Quantitative Neurogenetics & QTL Mapping
Genetic Structure
of Recombinant Inbred Mice.
A comprehensive analysis of linkage maps
of recombinant inbred strains with comparisons to F2, N2, and
advanced intercross maps. We genotyped just over 100 RI strains
using a set of approximately 1600 microsatellite markers. Published
October 2001 in Genome Biology by Rob Williams, Jing Gu, Shuhua
Qi, and Lu Lu. The papers is available both in PDF and HTML versions.
Our own local HTML version includes updated links to new RI genotype
data files. Users of RI strains (AXB-BXA, BXD, BXH, and CXB) will
find the mapping data sets useful.
Complexities
of Cancer Research: Mouse Genetics Models.
Cancer susceptibility is a complex interaction
of an individual's genetic composition and environmental exposures.
Huge strides have been made in understanding cancer over the past
100 yr, from recognition of cancer as a genetic disease, to identification
of specific carcinogens, isolation of oncogenes, and recognition
of tumor suppressors. A tremendous amount of knowledge has accumulated
about the etiology of cancer. Cancer genetics has played a significant
role in these discoveries. Analysis of high-risk familial cancers
has led to the discovery of new tumor suppressor genes and important
cancer pathways. These families, however, represent only a small
fraction of cancer in the general population. Most cancer is instead
probably the result of an intricate interaction of polymorphic
susceptibility genes with the sea of environmental exposures that
humans experience. Although the central cadre of cancer genes
is known, little is understood about the peripheral genes that
likely comprise the polymorphic susceptibility loci. The challenge
for cancer genetics is therefore to move forward from the Mendelian
genetics of the rare familial cancer syndromes into the field
of quantitative trait loci, susceptibility factors, and modifier
genes. By identifying the genes that modulate an individual's
susceptibility to cancer after an environmental exposure, researchers
will be able to gain important insights into human biology, cancer
prevention, and cancer treatment.
Strength
in Numbers: Chasing the Engram Using Microarrays.
A short report of a symposium at the 2001
IBANGS meeting.
QTL
analysis and genome-wide mutagenesis in mice: Complementary genetic
approaches to the dissection of complex traits.
An upbeat commentary in Behavior Genetics
on complex trait analysis and "cloning" QTLs that we
hope will counterbalance the gloomy assessment by Joe Nadeau and
Wayne Frankel (2000). Our review (John Belknap and colleagues)
is in a special issue of Behavior Genetics devoted to QTL mapping
and complex trait analysis. Spread the word: QTL analysis is thriving,
and yes they can be cloned.
Short
Course Tutorial in Quantitative Neurogenetics
An introduction to mapping quantitative
trait loci (QTLs) written for neuroscientists taking the 1998
Short Course in Quantitative Neuroanatomy. Updated August 2000
with new figures and text on RIX mapping.
Mapping
Genes that Modulate Mouse Brain Development: A Quantitative Genetic
Approach
A review chapter from Mouse Brain Development
that explains the power of QTL mapping in exploring CNS development.
This review included original data on brain weight and neuron
number in different strains of mice (C57BL/6J mice have about
100 million cells in their brains). My thanks to Richelle Strom,
Guomin Zhou, and Dan Goldowitz for allowing me use some of our
unpublished data in this review.
Genetic
Control of Neuron Number
Richelle C. Strom's Ph.D. dissertation (July
1999) on the quantitative genetic analysis of brain weight and
retinal ganglion cell number in mice. Seven chapters containing
lots of great new data on QTLs that modulate brain weight and
neuron number.
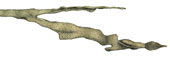
An example of a hippocampus used for gene mapping. This dissection
is from the left hemisphere. Five cross-sections illustrate internal
structure. For more details on this work and information on QTLs
that control hippocampal size and structure, see the JN paper
by Lu and colleages below.
Genetic
Architecture of the Mouse Hippocampus
Reprint of a paper by Lu Lu and colleagues
published in The Journal of Neuroscience (May 2001). We discovered
QTLs on chromosomes 1 and 5 that modulate size and neuron number
in the mouse hippocampus. In addition to the mapping, this paper
contains extensive morphometric data and cell counts on hippocampus
and its components as a function of age, sex, and brain weight.
We found an interesting gain in hippocampal weight with age that
may be related to continuous adult neurogenesis. We see a similar
increase in the olfactory bulbs, but not in the cerebellum.
Neurogenetic
Analysis of the Olfactory Bulbs in Mice
The olfactory bulbs are a great neural system
for quantitative genetic analysis (they are modular, discrete,
and easy to dissect). Here we describe a set of four QTLs that
control the weight of the olfactory bulbs. This paper also details
differences in bulb as a function of age, sex, and brain weight.
Published in Behavior Genetics, 2001.
Graphic illustration of the segregation of genotypes and phenotypes
modulating cerebellar size. Select the figure to get a higher
quality image. The left panel illustrates the distribution of
cerebellar weights for BXD strains that have been categorized
by genotype at the Cbs1a interval on Chr 1. C57BL/6J alleles (BB)
at Cbs1a are marked by blue circles; DBA/2J alleles at Cbs1a are
marked by red circles. The middle panel illustrates the even more
striking difference between strains categorized as BB or DD in
the Cbs8a interval on Chr 8. The right panel illustrates the conjoint
and almost perfectly additive action of these two QTLs.
Biometric
and QTL Analysis of the Cerebellum
Reprint of a paper in The Journal of Neuroscience
by David C. Airey and colleagues. This study covers both the total
size of the cerebellum and the fractional volume of different
cerebellar compartments. David and I mapped five QTLs with relatively
intense effects on cerebellar size in a cross between C57BL/6J
and DBA/2J and in BXD recombinant inbred strains. The figure above
shows the effects of two of these QTLs—singly and jointly—on
cerebellar weight in the BXD RI strains.
Complex
Trait Analysis of the Mouse Striatum
A stereological and genetic analysis of
the caudate nucleus by Rosen and Williams published in BMC Neuroscience
(2001; available online at www.biomedcentral.com/browse/biology).
While there is considerable strain variation in caudate volume,
there is less variation in the number of caudate neurons (mostly
medium spiny neurons). Using an F2 intercross we were able to
map two QTLs that independently control striatal volume (Chr 10)
and striatal neuron number (Chr 19).
Combining
Mutagensis and QTL Analysis: The Consomic Mutagenesis Screen
This paper describes a new technique to
exploit consomic mice (also known as chromosome substitution strains)
to increase the sensitivity of a recessive mutagenesis screen
by restricting analysis to entire litters of nearly isogenic mice.
The method is sensitive enough to detect QTLs and weak alleles.
The consomic mutatgenesis screen is being used by the Tenneessee
Mouse Genomics Consortium to generate and map CNS and behavioral
mutations on chromosome 19. This paper was published in Mammalian
Genome (1999).
Genetic
Dissection of Retinal Development
A paper on the genetic basis of variation
in the eye and retina published in Seminars in Cell & Developmental
Biology (1998) 9:249–255. We explain how QTL analysis can
be used to detect and characterize genes that modulate the architecture
of the eye and retina. We include original data on the genetic
control of (1) eye weight, (2) numbers of horizontal cells, and
(3) numbers of retinal ganglion cells. This paper was coauthored
with Richelle Strom, Guomin Zhou, and Yan Zhen.
Sketch of the retina, optic stalk, chiasm, and the lateral geniculate
nucleus of a mammal at an early stage of development. The retina
(lower left) has two walls—the outer pigment epithelium
and the inner neural retina. The choroid fissure splits the lower
half of the retina and continues as a groove on the base of the
optic stalk. Growth cones of ganglion cells (not shown) extend
across the inner surface of the retina and grow toward the root
of the fissure (the future optic nerve head) and into the ventral
part of the optic stalk (see oblique sketch at bottom right).
Illustration adapted by RWW from the Undiscovered Codex.
An
Analysis of Variation in Retinal Ganglion Cell Number in Mice
An updated and extended version of a paper
published in The Journal of Neuroscience (1996, pdf). This paper
address the role of genes and envrionmental factors in controlling
the size of cell populations in the central nervous system. Quantitative
electron microscopy was used to count neurons in retinas of over
450 animals. We measured effects of sex and age, heritability
of differences in neuron populations, and the number of genes
responsible for the substantial differences among strains of mice.
Updated May 30, 1998.
A Major
QTL on Chr 11 Controls Variation in Ganglion Cell Number
This paper follows up on the previous article
and was published in The Journal of Neuroscience (1998, pdf).
Our aim in this work was to map genes that produce large differences
in numbers of neurons in the retina. We succeeded in mapping a
gene locus called Neuron Number Control 1 or Nnc1, on chromosome
11 between Hoxb and Krt1. There are several great candidate genes
in this region, particularly the thyroid hormone alpha receptor.
Nnc1 is the first gene locus known to control normal variation
in neuron number in a vertebrate.
Cell Production
and Cell Death in the Generation of Variation in Neuron Number
published in The Journal of Neuroscience (1998, pdf).
Our third paper in this series on the genetic
control of the retinal ganglion cell population in mice. By estimating
total cell production in neonates from 10 different inbred strains
of mice, Richelle Strom was able to determine that the distinct
bimodality of strain averages is caused by differences in cell
production. This paper demonstrates that Nnc1 modulates cell production
and must be expressed before birth. However, there are some very
interesting differences in the severity of cell death among strains
that would be worth following up on. |