Note to the reader: This is a revised edition of a
paper published in NeuroReport (1997;8:3883–3887). The
definitive original print version is available from Lippincott Williams and Wilkins.
New figures, text, and links have been incorporated
into the revision. Revised HTML (http://www.nervenet.org/netpapers/Rosen/MRI97/MRIPaper.html)
copyright ©1999 by Glenn
D. Rosen
MRI VISUALIZATION OF FOCAL INDUCED NEOCORTICAL MALFORMATIONS OF THE RAT
Glenn D. Rosen & Deborah Burstein*
Dyslexia Research Laboratory, Beth Israel Deaconess Medical Center; Division of Behavioral Neurology , Beth Israel Deaconess Medical Center, 330 Brookline Avenue, Boston MA 02215; Harvard Medical School, Boston, MA 02115. *Department of Radiology, Beth Israel Deaconess Medical Center, 330 Brookline Avenue, Boston MA 02215; Harvard Medical School, Boston, MA 02115.
Glenn D. Rosen
Department of Neurology
Beth Israel Deaconess Medical Center
330 Brookline Ave
Boston, MA 02215
USA
Phone: (617) 667–3252
Fax: (617) 667–5217
Email: grosen@caregroup.harvard.edu
In an effort to determine whether small focal malformations of the neocortex could be visualized in vivo, focal microgyria were induced in the neocortex of otherwise normal rats by freezing injury to the developing cortical plate, and in adulthood the malformation was visualized using MRI. Induced microgyria of varying size were successfully visualized with MRI, and the location and extent of the malformation was confirmed on subsequent histology. This work has potential implications for the field of experimental neuropathology by enhancing the ability to study the behavioral and connectional consequences of these malformations in animals. In addition, this work points toward future research for the in vivo visualization of these small, focal malformations in humans.
Disorders of late neuronal migration to the cerebral cortex are associated with a wide variety of neurologic consequences (c.f.,1,2). One of the difficulties in studying these malformations in both humans and in the corresponding animal models (3–7) is the inability to visualize the full range of cerebrocortical malformations in vivo. Thus, although magnetic resonance imaging (MRI) has proven useful in the visualization of some of the more severe anatomic disturbances (8), more focal malformations have eluded in vivo visualization. For example, “band heterotopias” or “double cortex” (9–11), subcortical nodular heterotopias (12,13), schizencephaly (14), polymicrogyria (15,16), and pachygyria (17) are now commonly diagnosed, either singly, or in multiple combinations in the same brain (c.f.18) by MRI, whereas molecular layer ectopias and focal microgyria, malformations that have been identified on postmortem histologic examination of the brains of individuals with certain forms of epilepsy and developmental dyslexia (19,20) have proven to be difficult to visualize in vivo.
The main goal of this work was to determine if MRI could be used to visualize small focal malformations of the brain. We used an animal model in which anomalies of cortical development can be induced in rodents by injury to the cortical plate during neuronal migration. We therefore induced malformations similar to focal microgyria in the cortex of otherwise normal rats by freezing injury to the developing cortical plate, and attempted to visualize them using MRI with the eventual goal of applying this knowledge to the further investigation of experimental developmental neuropathology as well as to the visualization of small, focal malformations in humans.
MATERIALS AND METHODS
Pregnant Wistar rats were obtained from Charles River Laboratories (Wilmington, MA) on gestational day 16–18. In an initial series of experiments to determine the feasibility of the MRI studies, 8 pups were given freezing lesions targeted to the presumptive parietal cortex on postnatal day (P) 1 (the day of birth being P0). Between P50 and P100, these subjects had their brains imaged in a small animal MRI (see below), after which the animals were sacrificed by transcardial perfusion with 0.9% saline followed by 10% formalin, and their brains were subsequently processed for quick histology for comparison with the MRI images.
Once it was clear that the lesions could be observed by MRI, three additional pups were lesioned and their brains subsequently imaged with the goal of obtaining high level histology for comparison. For this second series, on the day after birth, 3 pups were assigned to receive either a bilateral freezing lesion targeted at the parietal cortex (n=2) or a left hemisphere freezing lesion of occipito-temporal cortex. On P50 these subjects had their brains imaged in a small animal MRI (see below). On P70, the animals were sacrificed by transcardial perfusion with 0.9% saline followed by 10% formalin, and their brains were subsequently processed for histology.
Induction of Microgyria
Microgyria were induced based on a modification of a technique by Dvorák and colleagues (3) and reported in detail elsewhere.6 On the day after birth pups were anesthetized via induction of hypothermia and an incision made in the antero-posterior plane of the skin over the midline, exposing the skull. A 2 mm diameter stainless steel probe cooled to -70°C by immersion in dry ice was placed on the skull over the left hemisphere 5 seconds. For parietally-lesioned subjects the probe was placed 1 mm caudal to bregma and 2 mm lateral to the midline, while temporal cortex lesions were placed 1 mm rostral to lambda and 4 mm lateral to the midline. Those receiving bilateral lesions were prepared identically to unilaterally-lesioned animals with the exception that a second, identical probe was used to lesion the right hemisphere symmetrically. After surgery, the skin was quickly sutured, subjects were marked with identifying ink injections to the footpads, warmed under a lamp, and returned to their mother.
MRI
The subjects were anesthetized (87% Ketamine/13% Xylazine; 100/mg kg i.p.) and placed in a 4.7 T 30 cm bore MRI instrument (Bruker Instruments, Billerica, MA) and their heads imaged. The general protocol was to first acquire a scout image in the sagittal plane from which a multislice coronal data set was obtained (see Figure 1). The sagittal scout was obtained with a gradient echo sequence, with TR/TE = 500/25 ms, a field of view (FOV) of 4 cm with a 128 matrix (in plane resolution of 312 µm), and a section thickness of 1 mm. The multislice coronal data set was chosen to cover the region of interest. Five to twelve contiguous slices were obtained with the parameters TR/TE = 500/10 or 300/20, a FOV of 3.2 cm, with a 128 matrix (in plane resolution of 250 µm), and a section thickness of 0.5 mm. Acquisitions were averaged for a total imaging time of 6–8 minutes.
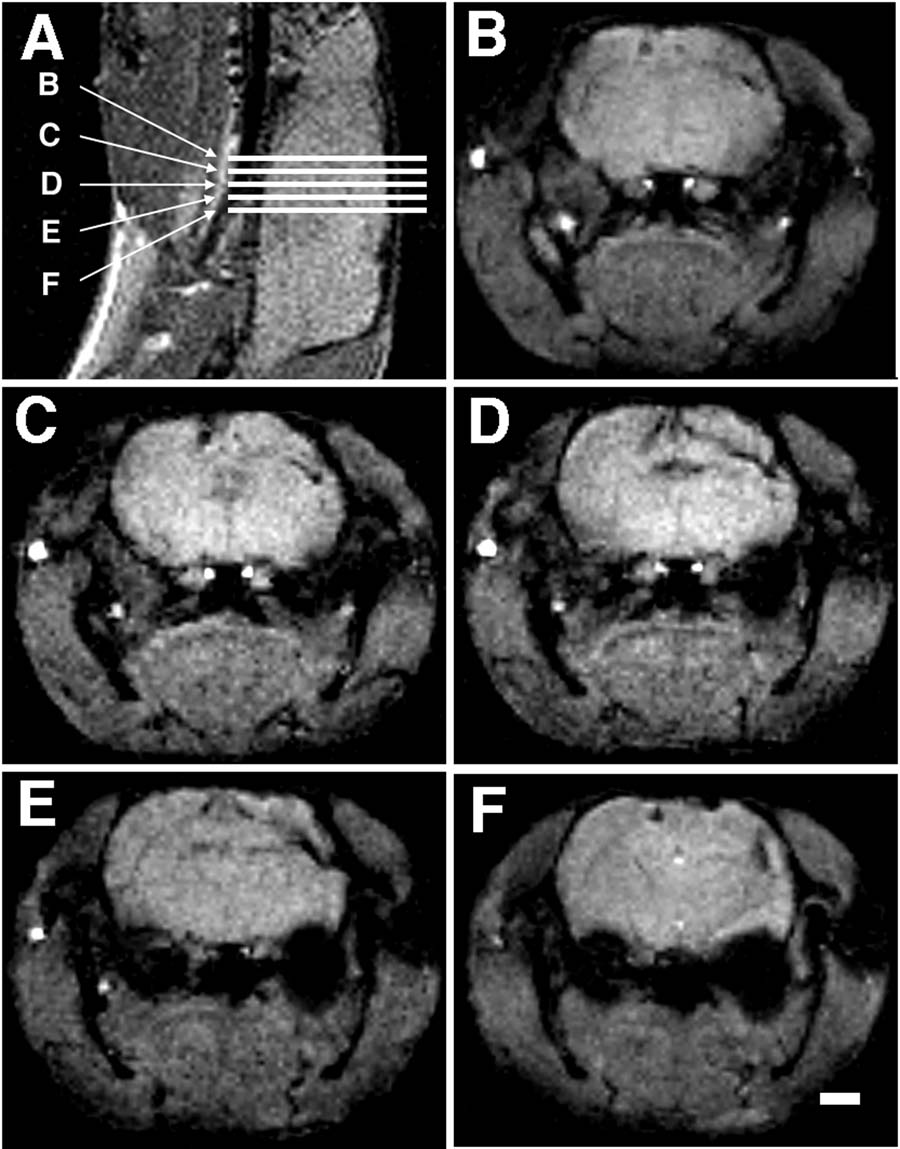 |
Figure 1. (A) Sagittal scout image (TR/TE = 500/25 ms, 312 µm in plane resolution) of a subject is first obtained and then used to guide subsequent acquisition of images in the coronal plane (B-F). Scale = 2 mm. Subject 38056 is shown in this example. |
Histology
Subjects were overdosed with Ketamine/Xylazine and were transcardially perfused with 0.9% saline and 10% formalin. For the first series of animals, the brains were immediately placed in a 30% formalin until they sunk. They were then serially cut in the coronal plane on a freezing microtome at 40 µm, and a series of every 10th section mounted on glass slides, stained with thionin, and coverslipped with Permount.
The three brains that were to be prepared for higher quality histology were removed from the skulls, post-fixed for 2 weeks, and then dehydrated in a series of 80%, 95%, 100% ethanol and ethanol/ether. The brains were placed into 3% celloidin for one week followed by 12% celloidin for 2–3 days. The celloidin block was trimmed to achieve a stable base and notched on the right side for side orientation. The sections were cut coronally on a sliding microtome at 30 µm and were segregated and saved in 80% ethanol. Every fifth section was stained for Nissl substance with cresyl violet. Sections were then mounted and coverslipped with Permount.
The volume of the microgyria were determined from systematic serial sections using point counting and Cavalieri‚s rule. Images from the sections were digitized and point counting was performed using NIH Image v. 1.55 running on an Apple Macintosh (Apple Computer, Cupertino, CA) Quadra 700. Total microgyric volume was determined using Cavalieri‚s estimation (21).
RESULTS
In the initial series of 8 rats, the lesions were detectable on MRI in all animals studied. The lesions varied from small microgyria (less than 2 mm3) to a large porencephalic cyst. All lesions were confirmed on frozen sections.
We were also able to visualize each of the anomalies in the second series of animals in which high quality histology was available. Their extent and localization were confirmed on subsequent histology (see Figure 2). The volumes of the lesions as determined by histology ranged from very small (Subject 38040; 1.83 mm3) to very large (left hemisphere of Subject 38056; 22.99 mm3).
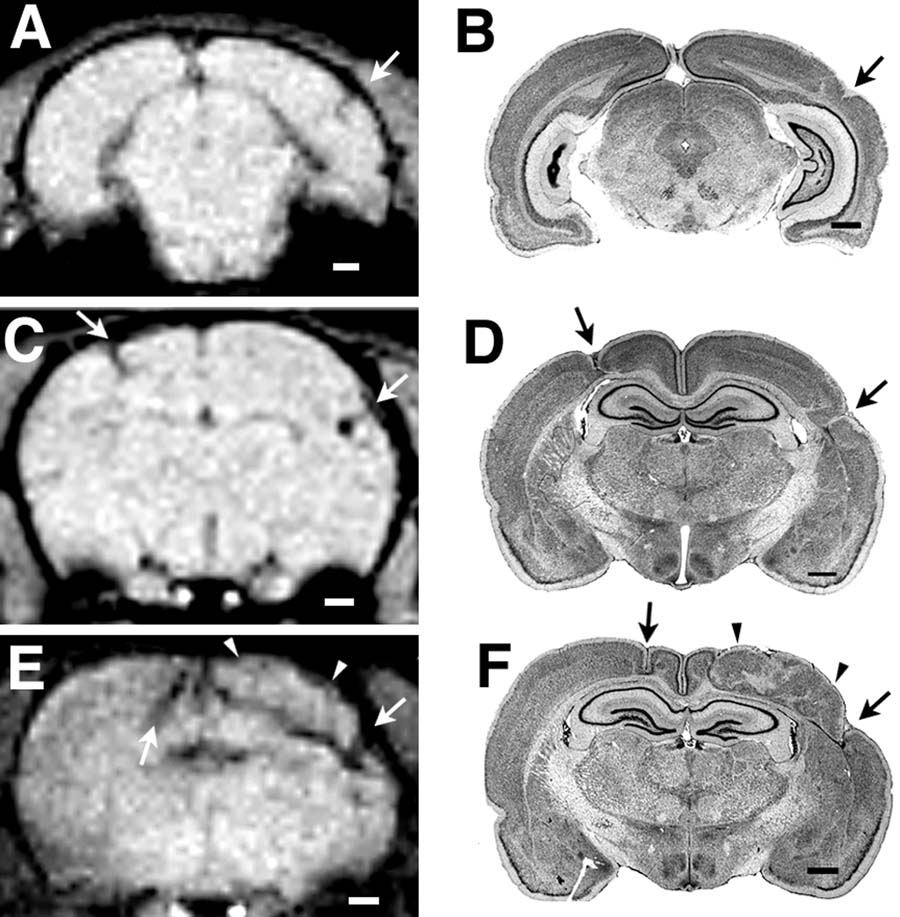 |
Figure 2.MRI and matched histology from the three cases reported. A. MRI (TR/TE = 500/10, 250 µm in plane resolution) obtained from the animal (Subject 38040) with the microgyria targeted to the occipito-temporal region (histology in panel B). Arrows indicate region of microgyria cortex. Microgyria volume on histology = 1.83 mm3. C. MRI (TR/TE = 300/20, 250 µm in plane resolution) obtained from one of the animals (Subject 38122) with a bilateral parietal microgyria (histology in panel D). Arrows indicate regions of microgyric cortex. Microgyric volume on histology: Left = 6.79 mm3, Right = 6.06 mm3. E. MRI (TR/TE = 500/10, 250 µm in plane resolution) obtained from the second animal with a bilateral parietal microgyria (Subject 38056). Matching histology section is in panel F. In the right hemisphere the malformation is medial and focal (volume on histology = 6.04 mm3), whereas in the left hemisphere it is larger (arrowheads; volume on histology = 22.99 mm3). Bar = 1 mm for all panels. |
DISCUSSION
The findings reported here suggest that MRI can be successfully used to visualize small malformations of the cortex. Using a gradient echo sequence, we were able to delineate the location and extent of these malformations, and subsequent postmortem examination of the brains confirmed these findings. These malformations were focal and ranged in size from 1.83 mm3 to 22.99 mm3. Allowing for the 50–55% shrinkage factor following histology, these malformations were still much smaller than those currently seen in MRI of human subjects.
The work reported here has potential implications for the field of experimental neuropathology. In addition to the induced malformations such as those reported here, the study of animal models of spontaneous malformations could benefit from these techniques. Specifically, molecular layer ectopias have been seen in a variety of immune-disordered mouse strains, but only in about 40% of individual mice within a strain (22) Having the ability to visualize these small induced anomalies in vivo could enhance our understanding of the connectional and behavioral consequences of these malformations. For example, knowing the precise location of these anomalies will allow targeting of tracer injections to the appropriate thalamic or cortical regions. Being able to determine affected from unaffected rodents a priori would also enable behavioral testing geared toward gaining a greater appreciation of the effects of extent and location. Finally, the ability to serially scan individual subjects longitudinally has the potential of increasing our understanding of the formation of these anomalies.
In the human, small malformations of the size reported here are currently only visible on postmortem examination, and unlike the more extensive disorders of neuronal migration (23,24), the known consequences of these anomalies are therefore somewhat limited (20,25). With the advent of magnets of increasing field strength and with more sophisticated sequences available, it is conceivable that malformations of the size reported here could be visualized in humans. Having this ability might allow for better understanding of the etiology of some forms of epilepsy, as well as other developmental disorders not yet linked to cerebrocortical malformations.
CONCLUSION
We successfully imaged focal induced malformations of the cerebral cortex of the rat using in vivo MRI, and the extent and location of these malformations were subsequently confirmed on histology. The ability to visualize these small malformations in vivo allows for a wide range of experiments to be conducted that were not previously feasible. In addition, these results point toward the visualization of these small, focal neocortical malformations in humans.
ACKNOWLEDGEMENTS
This work was supported, in part, by PHS grant HD20806. The authors thank Dr. Albert Galaburda for his comments on an earlier version of the manuscript. The authors also wish to acknowledge the technical expertise of Heinz Windzio.