Wildcat figures 3 and 4
Wildcat figures 3 and 4
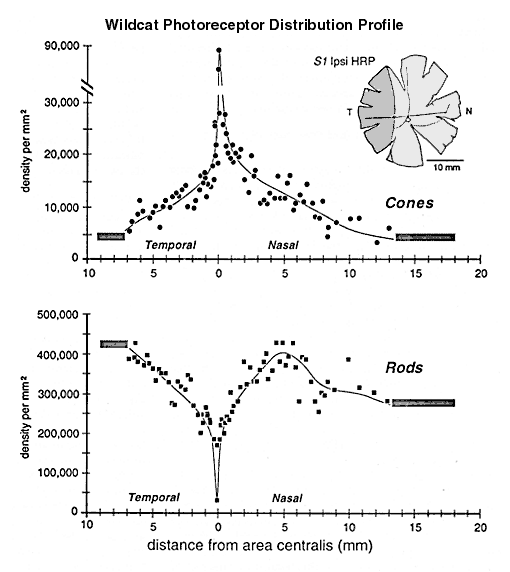
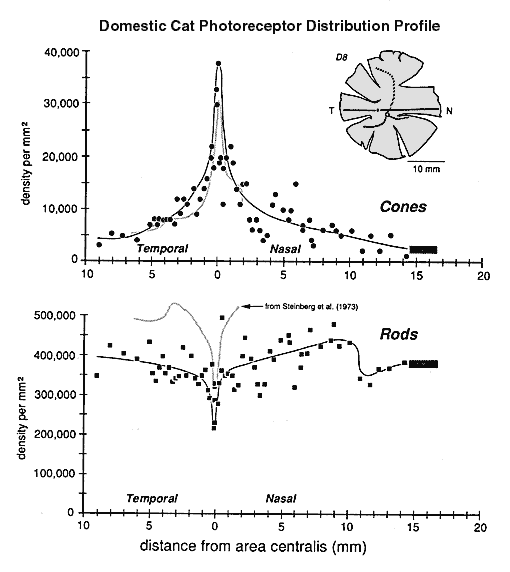
Figure 3.
Gradients in wildcat cone and rod densities through the area centralis and along the horizontal axis (male wildcat SI). The vertical axes in this figure and Figure 3 (domestic cat) are identical except that the y-axis is interrupted above 30,000 square mm. The gray bars at the far right and left of these plots represent eccentricities at which we could not make accurate measurements because of excessive retinal pigment. A sketch of the ipsilateral HRP-labeled retina in the upper right shows the horizontal line along which data were collected. T, temporal; N, nasal.
Figure 4.
Gradients in domestic cat cone and rod densities through the area centralis and along the horizontal axis (domestic cat D8). Faint gray curves in both A and B are taken from data in Steinberg et al. (1973). T, temporal; N, nasal.
Go back to Wildcat paper.