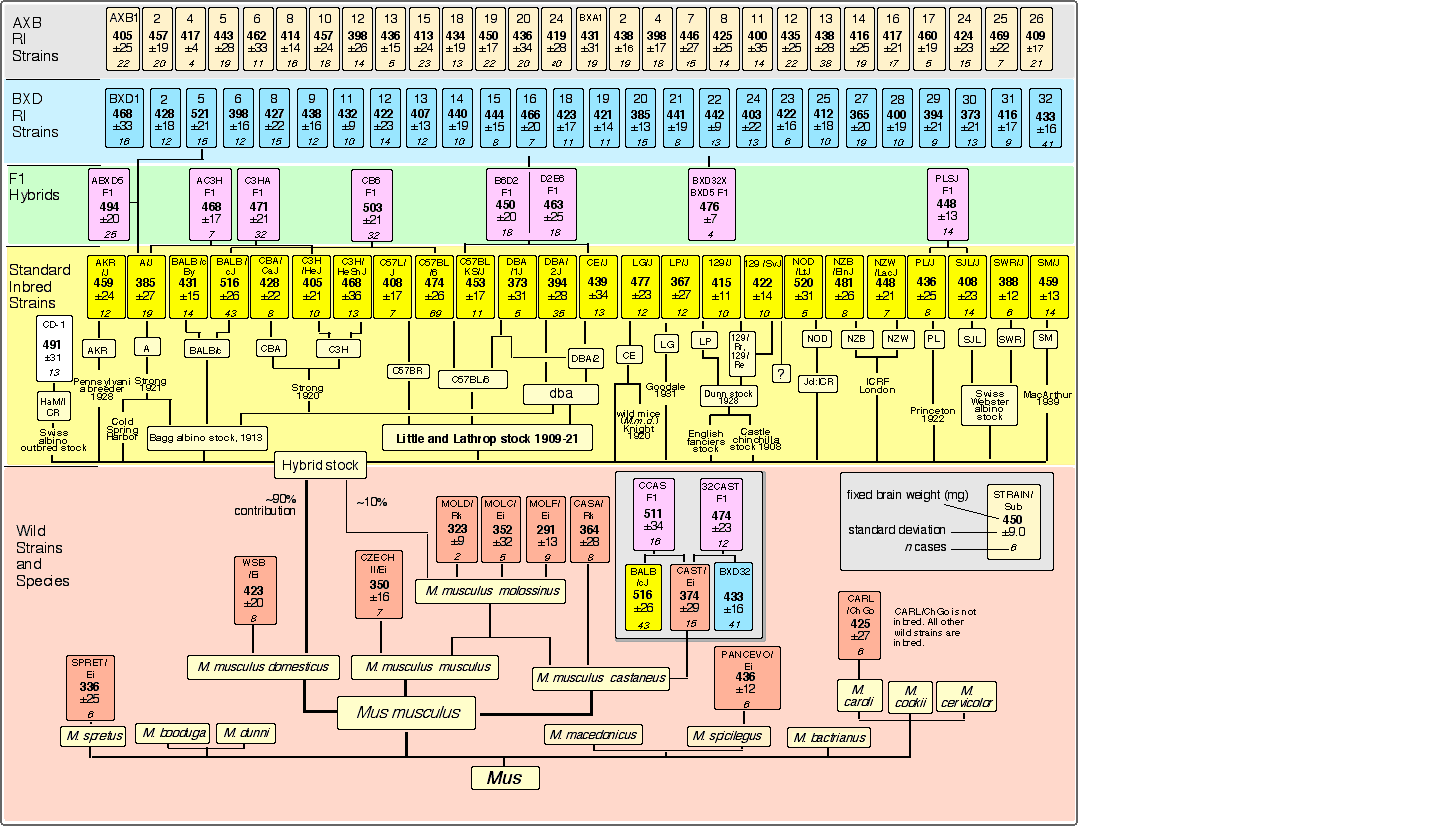

Figure 2.1.Lineage chart of the genus Mus with fixed brain weights for strains, species, and subspecies of mice. The major subdivisions of mice are indicated in the left margin and are described in the Materials and Methods section. The average brain weight, standard error of the mean (SEM) and the number of cases is listed for each strain.