 |
| |||||
|
| ||||||||
|
| ||||||||
Home  Publications Publications |
|
|
Note to the Reader R.R. Mize and R.S. Erzurumlu (Eds.) Progress is Brain Research, Vol. 108 © 1996 Elsevier Science B.V. All rights reserved.
Print Friendly Vision depends critically on having the right numbers of
cells, the right ratio of cell types, and the right distribution of cells
across the surface of the retina (Walls, 1942; Rodieck, 1973, 1988; Wassle
and Riemann, 1978; Sterling, 1983). In this paper we report and review
recent findings on how lineage plays a role in the establishment of these
important quantitative features in the mouse retina. We ask questions such
as: What is the relationship between individual progenitor cells and the
regional variation in retinal structure? What is the productive and
differentiative capacity of a single progenitor cell? How many progenitor
cells give rise to the retina? The underlying purpose of our work is to
elucidate the genes and developmental interactions that are responsible for
the intricate cellular architecture of the vertebrate retina. One endpoint
will be a better understanding of patterns of gene expression associated
with different retinal microenvironments and the differentiation of retinal
cell types. In mouse, evagination of the optic vesicle occurs on the
8th day of gestation (embryonic day 8.5 or E8.5). As in other vertebrates,
these cells are fated to contribute to an amazing diversity of tissue types:
the retina, the pigment epithelium, the optic nerve, and parts of the iris
and ciliary body. It is not known precisely how many cells are involved in
the evagination, but we estimate that the number is between 500 and 1000
(estimated from the work of Froriep, 1906). This population expands 10-20
fold (equivalent to about four or five rounds of symmetric division) before
the first postmitotic cells are generated on E11 (Sidman, 1961; Driiger,
1985). The list of cell phenotypes produced by these cells includes
photoreceptors, pigment producing cells, Muller glia, and the 20 or more
neuronal types and subtypes within the inner nuclear and ganglion cells
layers. By maturity, those progenitors have given rise to 5-10 million cells
(Goldowitz and Williams, 1992). How does one study these progenitor cells and the clones
of differentiated cells that they generate? Several approaches involve
labeling progenitor cells with a heritable marker. The marker can be an
exogenous dye or retrovirus that is injected into the retina, or the marker
can be an endogenous nuclear or cytoplasmic tag that is restricted to a
subpopulation of retinal progenitors. Studying retinal progenitors in vitro
under more controlled but less natural conditions is also highly informative
(e.g., Adler and Hatlee, 1989; Reh and KIjayin, 1989; Anchan et al., 1991).
Each method has advantages and disadvantages, some of which we consider
below. We have chosen to use endogenous cell markers to study
retinal development from its inception. Only a subset of the retinal
progenitor cells contain the endogenous marker. This is accomplished by
making chimeric mice that are a mixture of marked and unmarked cells. Two
embryos at the 8-cell stage are pushed together in vitro and the combined
embryo is then transplanted into the uterus of a pseudopregnant female.
Cells of one of the embryos contain the endogenous marker; cells of the
other are either unmarked or contain another distinct marker. A complete
description of this method is provided in a recent chapter (Goldowitz et
al., 1992). All tissues in chimeras can be a mosaic of the two genotypes of
cells. But the ratios of the two genotypes in a series of chimeras are
highly variable. For example, in some chimeras, the retina is composed of a
nearly balanced mixture (50:50), but in others, one genotype may make up
less than 5% of the cell population (see Fig. 1). This variation from
balanced to highly imbalanced contributions has proved to be a very valuable
feature of the chimera system. One of the most crucial aspects in the analysis of
chimeras is the identification of cell genotype. In studies of chimeras made
between chickens and quails, LeDourain and colleagues (LeDourain and Teillet,
1974; Balaban et al., 1988) have used prominent differences in the staining
of nucleoli between these avian species. Hunt and colleagues (OGorman et
a]., 1987) have used a selective quinacrine stain in transplantation
chimeras made between Xenopus borealis and X. laevis. Several
methods have now been developed to label cells of specific genotypes in mice
(Goldowitz et al., 1992). Criteria for a good marker are: (I) The marker should be inherited by all progeny of a
given progenitor cell. (2) The marker should not diffuse between cells. (3) The marker should be detectable in cells of all
phenotypes at all stages of development. (4) The marker should not interfere with development. (5) The genotype marker should be compatible with other
staining methods used to define cell phenotype and structure, particularly
immu nohistochemical methods. (6) Specifically for the retina, the marker should be
demonstrable in wholemounts because these preparations greatly improve the
speed and reliability of data analysis. Over the past 6 years we have explored several different
methods to label cells in chimeric mice. Two different transgenic lines of
mice, a globin transgenic line (Lo et al., 1987) and a beta-galactosidase
expressing line (Friedrich and Soriano, 1991) have been particularly
effective. The clonal structure of retina appears identical with the two
marker systems. Much of our current work uses the constitutively expressed
beta-galactosidase transgenic line (designated R0SA26). This transgene is
expressed in all retinal cells with the important exception of the
photoreceptors. But complementary labeling methods exploiting in situ
marking of cells with the globin transgenic mouse have allowed us to study
photoreceptors to yield an accurate view of the overall clonal architecture
of the mouse retina. Comparison of chimeras with other systems for studying
cell lineage The analysis of chimeric tissue complements studies that
employ retroviruses and dyes to label clones in vertebrate retina (Wetts and
Fraser, 1987; Holt et al., 1988; Turner et al., 1990; Huang and Moody, 1993;
Fekete et al., 1994). Each method has advantages and disadvantages.
Retroviral methods are often more suitable for studying individual clones
because the frequency of transfection can be controlled by adjusting the
titre of viruses injected into the embryonic eye. The age at which
progenitors are marked can also be varied systematically. A risk with
retroviral methods is that different types of viral constructs can be
associated with different labeling patterns (Turner and Cepko, 1987; Fekete
et al., 1994). For example, the viral construct CHAP does not label
photoreceptors (Fekete et al., 1994). It appears from these studies that
retroviral expression can be shut down in some members of a clone. A further
problem is that the virus is generally not integrated immediately after
injection (Fekete et al., 1994). As a result of this delay and the asymmetry
of integration of the retrovirus (only one progeny of the transfected parent
cell inherits the beta-galactosidase construct), the mean clone size is
usually smaller than would be anticipated based upon the age at which the
retroviral injection is made. Labeling cells with dyes overcomes some of these problems
(Wetts and Fraser, 1987; Holt et al., 1988; Huang and Moody, 1993). This
method has been particularly useful in determining the percentage of cells
in Xenopus retina derived from individual blastomeres at early stages
of development (Huang and Moody, 1993). The drawback is that dye injection
is impractical in vertebrate classes in which the clone size and volume
increase exponentially during development and dyes are quickly diluted.
Furthermore the injection of single cells, even in Xenopus embryos in
which the dilution of dye is not a key concern, is technically difficult.
Consequently, the total number of clones that have been examined with this
method is relatively small. Advantages and disadvantages of chimeras for studying
cell lineage There are two main advantages of chimeras. In terms of
examining global clonal structure of retina, the chimeric system provides a
large scale view of clones and polyclones across the entire retinal surface.
The density of clones and polyclones can be very high, particularly in the
balanced chimeras. Therefore, in a single retina one can ask whether there
are systematic differences in the size of cohorts between center and
periphery, or between nasal and temporal regions, or between right and left
sides. One also can detect apparent boundaries to clonal expansion. An
example of such a clonal restriction boundary is seen in the region of the
optic fissure in the majority of our chimeric retinal wholemounts (Fig.
1B,C). In chimeric retinas that are composed of very few cells from one
genotype, termed highly unbalanced chimeras, one can also estimate the size
of single clones of the minority genotype and thereby arrive at estimates of
the total number of cells that are the progenitors of retina (Rossant,
1990). Another unique advantage of chimeras is that one can generate a
retinal environment in which two genotypes with variant phenotypes are
juxtaposed. This juxtaposition may be between mutant (e.g., a photore ceptor
degeneration mutant mouse) and nonmutant genotypes (Mullen and LaVail, 1976)
or between mice with normal variation in retinal structure such as the total
numbers of retinal ganglion cells (Williams et al., 1993). Consequently,
chimeras have a unique role in determining the relative importance of
intrinsic and extrinsic factors in controlling the development of retina. Among the disadvantages of chimeras are (i) the lack of
control over ratios of the two genotypes that make up a tissue, and (ii) the
inability to label individual progenitors or clones in a discrete manner or
at different stages of development. These drawbacks make it impractical to
use chimeras to address the competence of individual progenitor cells in
retina. However the use of limited numbers of progenitor cells in blastocyst
injection chimeras or the use of special strains of transgenic mice in which
the expression of the cell marker is under inducible control may overcame
these limitations. Inter- and intra-species chimeras A critical issue raised by Jacobson (1991) is that the
two genotypes of cells in chimeras, particularly, interspecies chimeras, may
not mix in a normal pattern. Clustering of like-genotype cells in
interspecies chimeras could result from a secondary aggregation of clonally
unrelated cells; an idea that recalls the classic laboratory demonstration
of homotypic reaggregation of a mixture of cells from two species of
sponges. This process is unlikely to be important. Our first evidence is
that there is extensive intermixing of neurons and glia in the brains of
interspecies chimeras (Goldowitz, 1989). This reduces the likelihood that
selective affinity distorts clone structure in retina. The second line of
evidence is more direct: cohorts of cells in chimeras generated between
embryos belonging to the same species are just as sharply defined as those
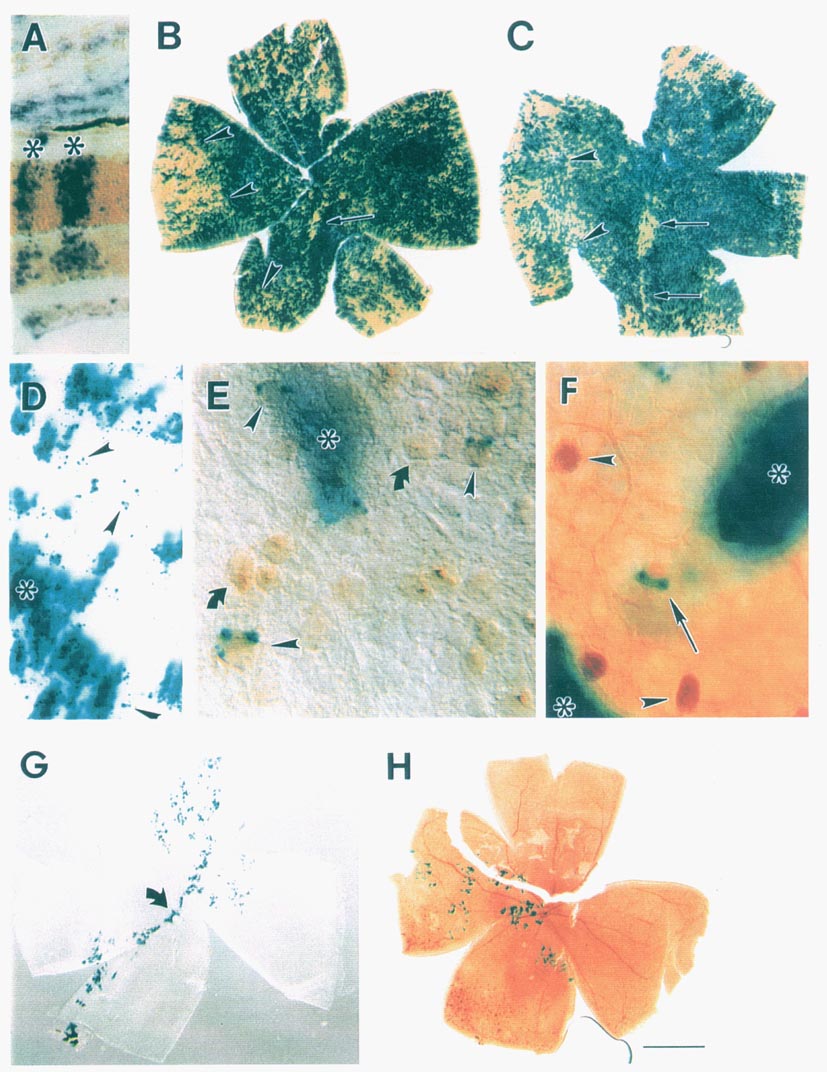
of interspecies chimeras (Fig. 1A). There is no qualitative or quantitative
difference in the mean clone or cohort size (Fig. 2 of this paper compared
to Fig. 2 of Williams and Goldowitz, 1992a). Finally, Reese et al. (1995)
have analyzed clones in X-inactivation mosaics in which marked and unmarked
cells are genetically identical, and they find similar clonal architecture
as in chimeras. While there may be subtle differences in clone size and
distribution among different types of chimeras (see below), fundamental
traits appear insensitive to genotypic differences. Global architecture of the mammalian retina The first analysis of chimerism in the eye relied on
easily detectable differences in pigmentation between albino and pigmented
cells (Mintz, 1971). The pattern of chimerism in the pigment epithelium of
these animals was reported to consist of radially arranged wedges centered
near the posterior pole of the eye. The inference was made that the neural
retina was also constructed out of a set of wedges of either pigmented or
albino cells centered on the optic nerve head (Mintz, 1971; Sanyal and
Zeilmaker, 1977), a reasonable deduction given the fact that pigmented and
neural retina are derived from the same neuroectoderm (Herrup and Silver,
1986). Work in mosaic Xenopus (Hunt et al., 1987a,b, 1988) has shown
much more clearly that large cohorts, derived by transplantation of
pigmented cells into albino retinas at early stages, generate wedges
oriented from center to periphery, like those illustrated in Fig. 3A. The advent of methods to label genotypes of individual
neurons and glia has made it possible to examine the clonal architecture of
entire mouse retina directly. Our first study (Rice et al., 1995b) relied on
visualizing, by in situ hybridization, DNA sequences found in only one of
the two genotypes of cells in chimeric retinas (Lo et al., 1987). This DNA
hybridization method worked well on 5-µm thick sections of retina, but could
not be successfully modified to reproducibly stain l00-µm thick retinal
wholemounts. But by using Friedrich and Soriano's (1991) transgenic mice,
the beta-galactosidase positive cells can be stained easily in thick slabs
of tissue, providing a means to study the clonal architecture in wholemounts.
The analysis of retinas from R0SA26 chimeras is now yielding a striking
picture of the size and distribution of clones and polyclones derived from
the two parental strains across the entire retina (see Fig. 1B,C,G,H).
Because the processes of Muller glia are well stained, borders between the
two genotypes can be traced through all layers of the retina, including the
acellular plexiform layers. It is evident that the clonal structure of mouse retina
is a patchwork of cells of the same genotype (blue transgenic cells and
unlabeled non-transgenic cells) that range in size from small clusters
containing fewer than 400 cells to large blocks con taining hundreds of
thousands of cells (Fig. 2A). In general, there are no striking differences
in the texture of the patchwork in dorsal or ventral retina, nor in nasal or
temporal retina. Differences, however, between central and peripheral retina
are present. The highly variable size of patches maybe a function of the
length of time over which clones of mitotically active cells remain packed
together. If a progenitor cell at E11 gives rise to a single clump of eight
mitotically active daughter cells, and if all the postmitotic cousins stay
together, then the final patch in adult retina may consist of several
thousand cells. If, on the other hand, these eight daughters move apart,
then the pattern will consist of a cluster of eight smaller patches of
labeled cells situated within the same retinal sector. It appears that the
retina is constructed in a jig-saw manner, and not like the slices of a pie.
However, there is a tendency for cohorts to have a long axis that is aligned
along the central-to-peripheral axis. This feature is most prominent in the
peripheral retina. Clearly the pie-model of retinal development (see Fig.
3A) proposed by Mintz (1971) and Sanyal and Zeilmaker (1977) fails to
account for the clonal patterns noted in chimeric mice. Our data is more
consistent with the patchwork model illustrated in Fig. 3B.
A consistent feature that we have discovered is a clonal
raphe or seam in the ventral half of the retina (Fig. 1B,C). It consists of
one or two bands of cells of the same genotype that extend with only limited
interruptions from the optic nerve head to the ventral periphery of the
retina. This seam probably results from the proliferation and migration of
progenitors along the margins of the optic fissure of the retina. When the
margins fuse (ca. E11-13), there is presumably only limited movement and/or
mixing of progenitor cells and their progeny across this junction. Thus it
appears that the closing of the optic fissure serves to mark a point in time
(somewhere between E11-E13) when the free movement of neuroepithelial cells
is restricted. Another boundary, apparently more impenetrable to the
expansion of neuroepithelial cells, is at the boundary between neural
retina, ciliary body, and pigment epithelium. Clones rarely extend from
retinal periphery into the adjacent pars plana of the ciliary body. This
feature suggests that neuroepithelial progenitors in this region are split
into two restricted lineages, one of which produces cells of the ciliary
body, the other only cells of neural retina. This recalls the clonal
restriction that occurs between cells in hindbrain rhombomeres (Fraser et
al., 1990). Clonal attributes of central and peripheral retina In most vertebrates, the central part of the retina
matures from days to weeks in advance of the peripheral part of retina
(Mann, 1964). The central- to-peripheral developmental gradient is most
striking in species that have large retinas and large differences in the
density of cells across the retinal surface. This group includes many
primates, carnivores, and birds. Given the big variation in cell density in
different parts of the retina, from high densities in the area centralis or
fovea to very low densities in the extreme periphery, one might anticipate
large differences in the size and shape of retinal clones in center and
periphery. If progenitors make a fixed number of progeny, then clones in the
periphery (low cell density) might be expected to spread out over a much
larger area than those in and around the fovea. Fekete et al. (1994) tested
this idea in chicken, and have clearly demonstrated the predicted
central-to-peripheral increment in clone area.
What would one expect to see in the mouse--a species with
a comparatively modest two-fold difference in cell density from the center
to the periphery (Rice et al., 1995a)? Assuming that progenitors produce
equal numbers of progeny, whether they are situated in the center of the
retina or near its edge, then clonal surface area should be inversely
proportional to cell density; lower densities corresponding to larger areas
per clone. We have looked for such a gradient in the retinas of the R0SA26
to BALB/cJ chimeras (Fig. 2B). We measured surface areas of isolated cohorts
(putative clones) of transgenic cells in central and peripheral retinas from
four chimeras. Highly imbalanced cases were used because isolated clusters
are easier to identify (e.g., Fig. 1G,H). The average size of the clones is
somewhat larger in central than peripheral retina (3216 ± 313 µm2,
n = 87 central; 2683 ± 207 µm2, n = 92 peripheral). However, this
average obscures an interesting trend seen in the histogram (Fig. 2B). There
are almost twice as many peripheral clones with areas be tween 3000 and 6000
µm2 in the periphery than in the center. This is consistent with
the idea that peripheral clones contain roughly the same numbers of cells as
those in the center and are stretched over a larger expanse of surface in
the periphery. Most of the very large cohorts (>5500 µm2) are
found close to the center (Fig. 2B). There are at least two explanations for
this apparently contradictory finding. (1) There may be less intermixing
among progenitor cells in the central retina early in development than in
the periphery. This might result in the production of large coherent clones
in central retina. Those in the periphery might break up into many smaller
clones; what Fekete et al. (1994) call "shotgun" clones (Fig. 1G,H). (2) The
ratio of the two genotypes may differ between center and periphery, with
consistently higher percentages of transgenic cells in the central retina.
There is a clear bias in this direction in all 15 of our albino to pigmented
retinas, including the two shown in Fig. 1B,C. Such a difference might
distort our quantitative analysis, and make the central cohorts appear
larger than those in the periphery. The mechanism that creates this biased
colonization may be similar to the developmental timing differences that
have been seen between neurons of the two genotypes in the dentate gyrus and
cerebellum in interspecies chimeras (Goldowitz, 1989). The development of
the albino retina is known to lag behind that of the pigmented retina
(Webster and Rowe, 1991), and this could lead to heterochronic distortions
of cell allocation. This idea is easily tested by making pigmented to
pigmented, transgenic chimeras. Lateral dispersion of early-generated cell types In retina, there is a consensus that clones form tight
radially aligned groups of cells. However, in our first study we
demonstrated that single ganglion cells, amacrine cells, and horizontal
cells were occasionally found situated in adjacent territory dominated by
the other genotype (Rice et al., 1992; Williams and Goldowitz, 1992a). Reese
et al. (1995) found similar dispersion of these first generated retinal
cells in murine X-inactivation mosaics. Fekete et al. (1994) have provided
additional evidence for tangential dispersion of cells in chicken retina.
There are two possible explanations for this phenomenon. Cells may simply
migrate short distances away from nearby, parental clones after their final
cell division. If cells do migrate, then it is of interest to know whether
they are doing this to produce a more orderly retinal mosaic or whether they
are just moving passively in response to extrinsic forces such as the
ingrowth of blood vessels and changes in retinal shape. Alternatively,
isolated cells may be members of small clones that are generated by
progenitor cells that become isolated or displaced from cells of the same
genotype. If the tangentially dispersed cells are clonally related then
these cells share a clonal history that is unique from radially-arrayed
clones and may well have unique patterns of gene ex pression in the
progenitor cells that establish these clones, implying that there may be at
least two progenitor populations in the mammalian retina. To address these alternative mechanisms, we examined
isolated horizontal, amacrine, and ganglion cells in wholemounts of R0SA26
transgenic chimeras (Fig. 1D-F). The frequency and type of isolated cells
were quantified at many sites in single retinas (Fig. 4). If the process
responsible for these isolated cells is based upon movement of early
generated cells away from a parental clone, then we may expect a monotonic
decline in their number as a function of distance away from the nearest
cohort of like-genotype cells. Alternatively, if the process responsible for
these isolated cells is an independent clonal event, then we may see more
complex patterns of distribution, e.g., small clones containing early
generated cell types with no clear spatial contiguity with larger cohorts of
like-genotype cells. In each retina studied, we find cells that are out of
register with the boundary of the nearest cluster of R0SA26 cells (Fig.
1D-F). These cells were identified as ganglion cells, amacrine cells, and
horizontal cells based upon the position and sizes of their cells bodies.
The identity of ganglion cells and horizontal cells was also confirmed using
histochemical techniques (Fig. 1E,F). Dispersion distances away from the
nearest like-genotype cluster were determined for each class of cell (Fig.
4). Ganglion cells were found to disperse farther than any other cell type.
These cells were found up to 120 µm away from their nearest genetically
identical cohort. Horizontal cells were found up to 60 µm away from the
nearest cohort. Amacrine cells were found up to 40 µm away from the nearest
cohort (see Fig. 4). The number of these isolated cells decreases as the
distance away from the nearest cohort increases. This monotonic decline is
consistent with the view that early generated retinal neurons move
tangentially from their parental clone during development.
The question arises if this lateral movement of ganglion,
horizontal, and amacrine cells is driven primarily by an active or passive
process. Lateral movement of ganglion cells is already known to occur during
the development of the human fovea (Yuodelis and Hendrickson, 1986).
Ganglion cells are displaced or migrate a considerable distance to build the
fovea. But this phenomenon is assumed to be restricted to species with a
well developed fovea. Our work suggests that small lateral movements of
ganglion cells may be a more common feature of retinal development even in a
species such as the mouse that does not have an obvious central retinal
specialization. Our findings are consistent with a passive process of cell
displacement that is due to two temporal and mechanical features of retinal
development. The first feature is that the early (E11-E13) retinal
neuroepithelium is more permissive to cell movement than the older
neuroepithelium. Early-generated celIs that leave the neuroepithelium in
this fluid environment become more dispersed. The second feature is the
expansion of the retina. Thus, the cell type that is most dispersed in
adults--ganglion cells--moves away from the tightly packed neuroepithelium
at the earliest age. Like cells in layer I of cortex, ganglion cells are
more able or prone to move tangentially than are later generated retinal
cells. The relationship between cell lineage and cell
phenotype One of the most important findings in the past decade in
the field of retinal development was the clear demonstration by Cepko and
colleagues, Holt and colleagues (Holt et al., 1988), and Wetts and Fraser
(1987) that single retinal progenitor cells labeled even fairly late in
development can produce a wide variety of retinal cell types. For example,
progenitor cells in early postnatal rats are able to produce both bipolar
cells and Muller glia (Turner and Cepko, 1987). This finding led to the
notion that retinal progenitors are not only able to make many retinal cell
types but they retain their ability to make all retinal cell types even late
in development, and that the environment alone has a controlling influence
on final cell phenotype. We tested this uniform progenitor cell hypothesis in two
ways: (i) by analyzing the large clones in chimeras (Williams and Goldowitz,
1992a), and (ii) by a systematic quantitative analysis of the retroviral
data set, Turner and Cepko (1987) and Turner et al. (1990) using a Monte
Carlo procedure (Williams and Goldowitz, 1992b). In essence, what we did was
to compare the mixture of phenotypes of cells generated by a computer
program with the real clones generated from E13 onward by Turner and
colleagues. Data on over 50,000 computer-generated clones were analyzed,
pooled, and then compared to the real data set. Several different models of
the sequence of retinal cell generation and cell death were tested in making
the computer clones. Despite the impressive qualitative impression that the
data gives of a heterogeneity of cell types in retroviral clones, our
quantitative analysis has shown that this heterogeneity is substantially
less than predicted even by a simple random model. The bottom line is that
the cell type composition of retroviral clones differs in surprising ways
from that predicted by exclusive environmental control. There are two
important technical caveats to this conclusion. First it is possible that
the retroviral clones were themselves skewed in cell composition. This could
happen if particular cell classes migrated away from the clone centers and
were scored as independent small clones, or if retroviral expression was
suppressed in some cell types. Second, it is possible that the kinetics of
cell production and cell death are so different from those assumed by the
model as to seriously compromise the model's validity. However, from our
recent studies of ganglion cell projection phenotypes (see below) and the
work on amacrine cell phenotypes in Xenopus (Huang and Moody, 1995),
there is mounting evidence that retinal neuroepithelial cells are partially
restricted in the pheno types they can normally produce. A special case for lineage restriction in ganglion cells
has been proposed by Jacobson and Hirose (1978). They found that each retina
in Xenopus is derived from blastomeres on both sides of the embryo.
They raised the possibility that the bilateral origins of the retina might
be associated with the division of ganglion cells into two populations; one
with crossed projections, the other with uncrossed projections. This
hypothesis can now be tested in chimeric mice by the examination of the
projection phenotype and the genotype of individual ganglion cells (Rice et
al., 1995b). The projection phenotype is assessed by backfilling cells with
horseradish peroxidase that yields a brown reaction product in the cell soma
(see Fig. 1E,H). The genotype of cells is determined by reacting the retina
using the beta-galactosidase X-gal reaction. Transgenic ganglion cells
contain distinct blue punctae of cytoplasmic label (Fig. 1 E). The
wholemounted retina is examined to determine if the cells of the ventral
temporal crescent (VTC) have a distinct clonal history and if individual
cohorts of like-genotype cells are biased in their production of ganglion
cells with ipsilateral or contra lateral projections. Our analysis demonstrates that the ventral temporal
crescent, the region that contains almost all ipsilaterally-projecting
ganglion cells, is not a clonal compartment with sharp boundaries separating
it from the rest of the retina. Small cohorts of cells appear to extend
without interruption or irregularity across the inner border of the VTC
(compare to the model in Fig. 3B). Individual clones probably contribute to
both retinal "compartments". While there may not be a sharp demarcation,
several chimeras have a clonal composition in the VTC that differs markedly
from that of the rest of the retina (Fig. lB,C). In the most compelling
case, about one-half of the border of the ventral-temporal crescent
corresponds nicely to a large difference in the proportions of the two
genotypes (Fig. IB). This difference in cell allocation suggests that the
VTC may have clonal origins that are somewhat different from the rest of the
retina. The question remains whether individual clones in the VTC produce
ganglion cells of a single projection phenotype. The fine grained analysis of single labeled and unlabeled
ganglion cells within the ventral temporal crescent of mice is providing
evidence for lineage restriction. This region contains the vast majority of
the 1500 or so ganglion cells that project ipsilaterally, but it also
contains a population of about 9000 contralaterally projecting cells (Drager
and Olsen, 1980; Drilger, 1985; Rice et al., 1995a). If the ganglion cell
mixture within single clones reflects the ratio of the two types of cells in
this part of the retina, then clones should not differ significantly from
the predicted 1:6 ratio. In contrast, if some clones consist largely of
ipsilateral cells and contain few, if any, contralateral cells, then one can
infer that phenotypes are not assigned randomly and that the progenitors
that gave rise to the ganglion cells may have become restricted. We have
recently found evidence for such restriction in our analysis of single
clones. For example, the small, isolated clone in Fig. 1E (asterisk and
arrowheads) contains at least three ipsilaterally projecting ganglion cells
and at most a single contralaterally projecting ganglion cells (a blue, not
HRP-labeled ganglion cell). While this analysis is still preliminary, these
findings suggest some level of lineage restriction may control this aspect
of ganglion cell phenotype. Similar findings are emerging in Xenopus
in which it has been shown that there is a partial lineage restriction in
the pro duction of amacrine cells and amacrine cell subtypes (Huang and
Moody, 1995). Analysis of highly imbalanced chimeras and the origins
of the retina One of the powers inherent in the analysis of chimeric
tissue is that an estimate can be made of the number of progenitor cells
that give rise to any tissue. The retina is particularly suitable for this
analysis because it develops from a discrete and isolated neuroepithelium.
The simplest estimate of progenitor cell number is made from the most
imbalanced chimeric retina. This lowest percentage chimera illustrates what
might be a single progenitor cell's proliferative potential and progeny. In
our analysis of interspecies chimeras we found that the lowest percentage
chimeras were between 1 and 2%, suggesting that the retinal progenitor pool
is comprised at least 50-100 cells (Williams and Goldowitz, 1992a). However,
these estimates were derived from sectioned material that precluded an
analysis of the whole retina. A more accurate means to assess the percentage
contribution of cells and their distribution is with a wholemount
preparation. We find a limited number of labeled cells that colonize
the retina in several of our transgenic chimeras. For example, in Fig. 1 G,H,
two cases of low percentage chimeras are shown with cohorts of labeled cells
that are restricted to a limited region of retinal space. This finding
suggests that the original cells that gave rise to these clones are limited
in number, since we know that the retina (at least before E13) provides a
fairly fluid environment for cell movement; the more progenitor cells we
start with the greater the likelihood that cohorts will be strewn all about
retina. The retina pictured in 1H had the fewest number of labeled cells of
all other retinas examined. The number of labeled cells was about 1000th of
the total number of retinal cells (about 100,000 cells were labeled in a
retina estimated to contain about 5-10 million cells). Interestingly, other
very low percentage chimeras (such as the one pictured in G) had reasonable
multiples of this "quantal" number. Thus, from the analysis of wholemounted
chimeric retinas we were able to adjust upwards the estimated number of
progenitor cells that establish retina to a pool of at least 1000 cells. The
localized nature of the like-genotype cohorts in the retina pictured in Fig.
1H suggests that these cohorts may be the progeny of a single progenitor
cell. Furthermore, the number of progenitor cells we estimate is similar to
the approximate number of cells that compose the early anlage of the retina
(estimated from Froriep, 1906). If the blue transgenic cells in the retina pictured in
Fig. 1H truly arise from a single progenitor cell, then the clonal
allocation of cells in this retina provides a picture of what a single
progenitor cell can do. A single progenitor cell produces spatially
restricted subelones that appear to be focused on the optic disk. The
distribution of subelones appears to be organized along the
central-to-peripheral axis. The minimum size of a subelone is about 175 µm2.
This minimum corresponds to single subclones that contain about 120-250
cells, equal to the progeny that would be produced by 7 or 8 rounds of
symmetric cell division. Since the first postmitotic cells are generated as
early as E11, many of these progeny are the products of asymmetric divisions
stretched out over nearly two weeks (E11-E19 = PO-P6) and as many as 20-25
cycles of cell division. Continuing in a retrospective vein, it is possible
to estimate the time when these 1000 cells are set aside as the progenitor
pool for retina. We have calculated the number of cells in the E11.5 retinal
neuroepithelium to be about 12,000 (Goldowitz and Williams, 1992a). This
means that a single progenitor cell (1/1000 of the retinal neuroepithelium)
would produce 12 cells at E11.5. Working back in time, assuming a cell cycle
of about one-half day, these 12 cells would take about two days to be
generated. We conclude, then, that the original progenitor cells of retina
are established around E9-E9.5. This period corresponds with the optic
vesicle stage of retinal development and the time that Pax6, a master
control gene for retinal development (Halder et al., 1995), is expressed in
the cells of the optic vesicle (Walther and Gruss, 1991). We can antedate the origins of retina to an even earlier
time in development. In the analysis of interspecies chimeras there is a
clear correlation between the percentage chimerism in the right and left
retinas of an animal (Williams and Goldowitz 1992a). In intraspecies
chimeras, where we have a more accurate picture of percentage chimerism,
there is also a strong correlation (r = 0.98) between the percentage
chimerism in right and left retinas. The consistency of these findings
supports a notion that early in development (around E7-E7.5) the future
retinas originate from a common pool of progenitor cells. Neuronal
precursors congregate at the future midline and are split into two
populations of precursors that generally rellect the original precursor
pool. These events would best describe the right/left symmetry of cell
allocation that is seen in neural retina as in other parts of the CNS. Summary and conclusions The study of chimeric retinas has yielded insight on the
early development of retina. The close match in chimerism ratios between
right and left retinas is significant and supports the idea that both
retinas originate from a common population of progenitors. We are able to
estimate numbers of progenitor cells that contribute to the formation of the
retina and the approximate time at which this small group is isolated from
surrounding prosencephalic cell fields. These cells undergo at least five
rounds of division before the first retinal neurons are generated. The mouse
retina is not built from the center outward. There is simultaneous expansion
and differentiation in all parts of the retina and as a result clones are
not arranged in wedges. Instead the mouse retina is a patchwork of clones
that do not differ greatly in size from center to periphery. The most
consistent radial feature in mouse retina is a raphe left at the line of
fusion of the margins of the ventral fissure. Processes that shape the clonal patchwork are both
passive and active, intrinsic and extrinsic. Certain features of the clonal
architecture of the retina, such as the size differences of clones are
primarily passive responses to extrinsic forces on progenitor cells and
their progeny. The fifteen-fold range in the size of cohorts is not due to
intrinsic differences in the proliferative capacity of individual progenitor
cells, but is due to the extent of cell movement and mixing at early stages
of development. In contrast, active or intrinsic processes are illustrated
by the partial (and still controversial) restriction of retinal progenitors,
the possible clonal differences between ganglion cells with crossed and
uncrossed projections, and the consistent differences in ratios of albino
and pigmented genotypes in peripheral and central retina. Acknowledgements Supported by RO1 EY-8868 and EY-9586 to D.G. and R.W. References Adler. R. and Hatlee, M. (1989) Plasticity and
differentiation of embryonic retinal cells after terminal mitosis.
Science, 243: 391-393. Anchan, R.M., Reh, T.A., Angello, J., Balliet, A. and
Walker, M. (1991) EGF and TGF-beta stimulate retinal neuroepithelial cell
proliferation in vitro. Neuron, 6: 923-936. Balaban, E., Teillet, MA. and Le Douarin, N. (1988)
Application of the quail-chick chimera system to the study of brain
development and behavior. Science, 241: 1339-1342. Conway, K., Feiock, K. and Hunt, R.K. (1980) Polyclones
and patterns in the growing Xenopus eye. Curr. Top. Dev. Biol.,
I5: 217-317 Drager, UC. (1985) Birth dates of retinal ganglion cells
giv ing rise to the crossed and uncrossed optic projections in the mouse.
Proc. R. Soc. London B, 224: 57-77. Drager, U.C. and Olsen, J.F. (1980) Origins of crossed
and uncrossed retinal projections in pigmented and albino mice. J. Comp.
Neurol., 191: 383-412. Drager, U.C. and Olsen, J.F. (1981) Ganglion cell
distribution in the retina of the mouse. In vest. Ophthalmol. Vi.s. Sci.,
20: 285-293. Fekete, D.M., Perez-Miguelsanz, J., Ryder, E.F. and Cepko,
C.L. (1994) Clonal analysis in the chicken retina reveals tangential
dispersion of clonally related cells. Dev. Biol., 166: 666-682. Fraser, S., Keynes, R. and Lumsden, A. (1990)
Segmentation in the embryo hindbrain is defined by cell lineage
restrictions. Nature, 344: 431-435. Friedrich, G. and Soriano, P. (1991) Promoter traps in
embryonic stem cells: a genetic screen to identify and mutate developmental
genes in mice. Genes Dev., 5: 1513-1523. Froriep, A. (1906) Die Entwicklung des Auges der
Wirbeltiere. In: 0. Heriwig (Ed.), Handbuch der Vergleichenden und
experimentellen Entwicklungslehre der Wirbeltiere. Gustav Fischer, Jena,
pp. 139-261. Goldowitz, D. (1989) Cell allocation in mammalian CNS
formation: evidence from murine interspecies aggregation chimeras.
Neuron, 3: 705-713. Goldowiiz, D. and Williams, R.W. (1992) Dynamics of mouse
retinogenesis: a population and clonal analysis. Neurosci. Abstr.,
18: 1318. Goldowitz, D., Moran, T.H. and Welts, R. (1992) Mouse
chimeras in the study of genetic and structural determinants of behavior.
In: D. Goldowitz, R. Wimer and D. Wahlsten (Eds.), Genetic Analysis of
Brain and Behavior: Focus on the Mouse, Elsevier, Amsterdam, pp.
271-290. Halder, G., Callaerts, P. and Gehring, W.J. (1995)
Induction of ectopic eyes by targeted expression of the eyeless gene
in Drosophila. Science, 267: 1788-1792. Harris, W. and Hartenstein, V. (1991) Neuronal
determination without cell division in Xenopus embryos. Neuron,
6: 499-515. Herrup, K. and Silver, J. (1986) Genetic mosaics as tools
for the study of the retina. In: R. Adler and D. Farber (Eds.), The
Retina, Academic Press, New York, pp. 245-274. Holt, CE., Bertsch, T.W., Ellis, H.M. and Harris, WA.
(1988) Cellular determination in the Xenopus retina is independent of
lineage and birth date. Neuron, 1: 15-26. Huang, S. and Moody, SA. (1993) The retinal fate of
Xenopus cleavage stage progenitors is dependent upon blastomere position
and competence; studies of normal and regulated clones. J. Neurosci.,
13: 3193-3210. Huang, S. and Moody, SA. (1995) Asymmetrical blastomere
origin and spatial domains of dopamine and neuropeptide Y amacrine subtypes
in Xenopus tadpole retina. J. Comp. Neurol., 360: 2-13. Hunt, R.K., Cohen, IS. and Mason, B.J. (1987a) Cell
patterning in pigment-chimeric eyes of Xenopus: local cues control
the decision to become germinal cells. Proc. Natl. Acad. Sci. USA,
84: 5292-5296. Hunt, R.K., Bodenstein, L.. Cohen, IS. and Sidman, R.L.
(1988) Positional variations in germinal cell growth in pigment-chimeric
eyes of Xenopus: posterior half of the developing eye studied in
genetic chimerac and in computer simulations. Proc. Natl. Acad. Sci. USA,
85: 3459-3463. Jacobson, M. (1991) Developmental Neurobiology,
3rd edn. Plenum, New York. Jacobson, M. and Hirose, G. (1978) Origin of the retina
from both sides of the embryonic brain: a contribution to the problem of
crossing at the optic chiasm. Science 202: 637-639. Le Douarin, N. and Teillet, M.A. (1974) Experimental
analysis of the migration and differentiation of neuroblasts of the
autonomic nervous system and of neuroectodermal mesenchymal derivatives
using a biological cell marking technique. Dev. Biol., 41: 162-184. Lo, C.W., Coulling, M. and Kirby, C. (1987) Tracking of
mouse cell lineage using microinjected DNA sequences: analyses using genomic
Southern blotting and tissue-section in situ hybridization.
Differentiation, 35: 37-44. Mann, I. (1964) Development of the Human Eye.
Grune and Stratton, New York. Mintz, B. (1971) Genetic mosaicism in vivo:
development and disease in allophenic mice. Fed. Proc., 30: 935-943. Mintz, B. and Sanyal, 5. (1970) Clonal origin of the
mouse vistial retina mapped from genetically mosaic eyes. Genetics.
64(Suppl.), S43-S44. Mullen, RI. and LaVail, MM. (1976) Inherited retinal
dystrophy: primary defect in pigment epithelium determined with experimental
rat chimeras. Science, 192: 799-801. OGorman, S., Kilty, J. and Hunt, R.K. (1987) Healing and
growth of half-eye "compound eyes" in Xenopus: application of an
interspecific cell marker. J. Neurosci., 7: 3764-3782. Reese, B.E., Harvery, AR. and Tan, S.S. (1995) Radial and
tangential dispersion patterns in the mouse retina are cell-class specific.
Proc. Natl. Acad. Sci. USA, 92: 2494-2498. Reh. TA. and Kljavin, 1.1. (1989) Age of differentiation
determines rat retinal germinal cell phenotype: induction of differentiation
by dissociation. J. Neurosci., 9: 4179-4189. Rice, D. S., Williams, R. W. and Goldowitz, D. (1992)
Clones and polyclones in the retinas of intraspecies mouse chimeras. Soc.
Neurosci. Abstr., 18: 1382. Rice, D. S., Williams, R.W. and Goldowitz, D. (1995a)
Genetic control of retinal projections in inbred strains of albino mice.
J. Comp. Neurol., 354: 459-469. Rice, D. S., Williams, R.W. and Goldowitz, D. (1995b)
Clonal analysis of retinal ganglion cells with crossed and uncrossed
projections. Soc. Neurosci. Abstr., 21: 529. Rodieck, R.W. (1973) The Vertebrate Retina. Principles
of Structure and Function, Freeman and Co., San Francisco, CA. Rodieck, R.W. (1988) The primate retina. Comp. Primate
Biol., 4: 203-278. Rossant, J. (1990) Manipulating the mouse genome:
implications for neurobiology. Neuron, 2: 323-334. Sanyal, S. and Zeilmaker, G.H. (1977) Cell lineage in
retinal development of mice studied in experimental chimeras. Nature,
265: 731-733. Sidman, R.L. (1961) Histogenesis of the mouse retina
studied with thymidine-H3. In: G.K. Smelser (Ed.), The
Structure of the Eye, Academic Press, New York, pp. 487-506. Sterling, P. (1983) Microcircuitry of the cat retina.
Annu. Rev. Neurosci., 6:149-185. Turner, DL. and Cepko, C.L. (1987) A common progenitor
for neurons and glia persists in rat retina late in development. Nature,
328: 131-136. Turner, DL, Synder, E.Y. and Cepko, CL. (1990)
Lineage-independent determination of cell type in the embyronic mouse
retina. Neuron, 4: 833-845. Walls, G.L. (1942) The Vertebrate Eye and its Adaptive
Radiation, Hafner, New York. Walsh, C. and Cepko, CL. (1992) Widespread dispersion of
neuronal clones across functional regions of the cerebral cortex.
Science, 255: 434-440. Walther, C. and Gruss, P. (1991) Pax-6, a murine
paired box gene, is expressed in the developing CNS. Development,
113: 1435-1449. Wassle, H. and Reimann, H.J. (1978) The mosaic of nerve
cells in the mammalian retina. Proc. R. Soc. London [Biol.], 200:
441-461. Webster, M.J. and Rowe, M.H. (1991) Disruption of
developmental timing in the albino rat retina. J. Comp. Neurol., 307:
460-474. Wetts, R. and Fraser, SE. (1987) Multipotent precursors
can give rise to all major cell types of the frog retina. Science,
239: 1142-1145. Williams, R.W. and Goldowitz, D. (1992a) Structure of
clonal and polyclonal cell arrays in chimeric mouse retina. Proc. Natl.
Acad. Sci. USA, 89: 1184-1188. Williams, R.W. and Goldowitz, D. (1992b) Lineage versus
environment in embryonic retina. A revisionist perspective. Trends
Neurosci., 15: 368-373. Williams, R.W., Rice, D.S. and Goldowitz, D. (1993)
Genetic control of neuron number: ganglion cell populations in mouse.
Soc. Neurosci. Abstr., 19: 53. Youdelis, C. and Hendrickson, A. (1986) A qualitative and
quantitative analysis of the human fovea during development. Vis. Res.,
26: 847-855. Since 16 June 99
|
Neurogenetics at University of Tennessee Health Science Center
| Print Friendly | Top of Page |
Mouse Brain Library | Related Sites | Complextrait.org
