 |
| |||||
|
| ||||||||
|
| ||||||||
Home  Publications Publications |
|
|
Note to the Reader Short Course on Quantitative Neuroanatomy Organizers: John H. Morrison and Patrick R. Hof Society for Neuroscience Education Committee Saturday, November 7, 1998 (2:30-3:00 pm) Westin Bonaventure Hotel and Suites, Los Angeles, CA
Print Friendly The methods detailed below can be used to detect differences of 4 bp or
more in the length of PCR reaction products between 90 and 160 bp. The gel is made of 2.5�3.0% MetaPhor agarose (FMC Corp,
http://www.bioproducts.com) mixed in 1X TBE buffer. Ethidium
bromide at a concentration of 0.5 �g/ml is added to fresh gel before
polymerization (typically 300 ml of buffer; 9 gm of MetaPhor agarose, 15
�l of 10 mg/ml EtBr). We cast gels for use with the Bio-Rad Subcell Model
192 electrophoresis system (Bio-Rad, 1-800-424-6723). These gels are large
and relatively thin (gel dimensions are 25.5-cm-tall, 24.5-cm-wide and 3-
to 4-mm-thick). Gels are cast with a total of 204 wells arranged in four
rows of 51 wells. Only 48 wells per row are typically used. Each well is
small (0.75 mm front-to-back, 3 mm right-to-left, and 2.5 mm deep).
Adjacent wells are separated by 4.5 mm�two times the distance between the
tips of the 12-channel multipipetter. All of the PCR reaction product (now usually about 8.5 �l) is loaded
into a well using a 12-channel pipette (Eppendorf or equivalent) and
0.1�10 �l tips (Fisher Redi-Tip, Cat # 21-278-2). PCR products in the
eight rows of the 96-well plate are interleaved across rows of the gel:
Row A to odd lanes 1 to 23; row B to even lanes 2 to 24, row C to odd
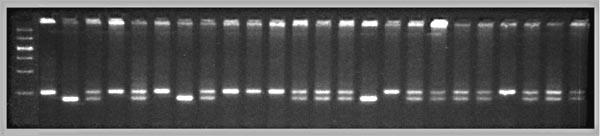
lanes 25 to 47, row D to even lanes 26 to 48, etc. Gels are run at 170 volts�equal to about 6.7 V/cm. Under these
conditions the PCR products are usually well separated after 80 minutes.
Note that the voltage gradient can be raised as high as 16 volt/cm to
shorten time and improve band resolution. The gels are loaded at a
temperature of 15 degrees while immersed in 1X Tris/Boric acid/EDTA
buffer. We circulate the gel buffers through a cooling bath (Fisher
Isotemp refrigeration unit 1016S with a Bio-Rad variable speed fluid pump)
to maintain gel temperature at 18 to 20 deg. After the run is complete,
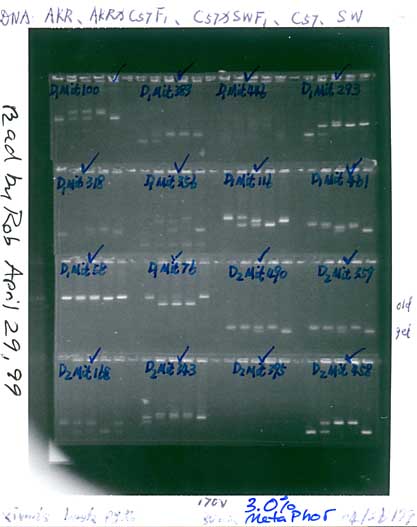
gels are moved onto a large UV illuminator and cut apart into managable-sized
pieces that can be photographed using a simple Polaroid system. For PCR we use a set of 4 PTC-100 and PTC-200 cyclers with hot-top
96-well blocks Economizing: MetaPhor agarose is expensive ($2 per gram). We
typically recycle all parts of gels that do not contain abundant amounts
of PCR product. Large slabs are remelted and used again and again. In each
cycle of recycling we typically add 2 �l of a 10 mg/ml solution of EtBr.
Photography is also expensive. An entire gel with 192 lanes can be
photographed using just two exposures. The gel is first cut vertically
down the middle. Then the important parts are sliced out and arranged
close to each other in four rows (11 cm wide and 15 cm high) on a UV
transilluminator (Fisher FBTIV-614). We use an Eicker brain knife to slice
gels. The gel left-overs are put in a 1000 ml beaker for eventual
recycling. A small Fotodyne hood (Cat 5-5342) is used with a hand-held
Polaroid instant camera. Exposures are 0.5 sec at F8. Film is Polaroid
Polapan 667 (3.25 by 4.25 inch). We have designed Excel and FileMaker files that allow rapid entry of
genotype data using a numeric keypad (8 = high band homozygote, 2 = low
band homozygote, 5 = heterozygote). Trouble-shooting: If amplification of PCR product is not uniform
or the apparent concentration of the product on the gel is too low, assess
the following factors: Our thanks to Drs. Xiyun Peng, Guomin Zhou, Jing Gu, and Lu Lu for
improving the efficiency and reliability of these methods. 1. Is there any particular reason to use Ficoll rather than sucrose in
the PCR? ANSWER: No. We initially used sucrose, but Ficoll works
slightly better. (I think that it may be a bit heavier than 60% sucrose,
but would need to verify this.) 2. Does cresol red run with the DNA of a particular size in a 3%
metaphor gel? (or maybe it runs the wrong way). ANSWER: The cresol
red will run close to the primer dimer (less than 75 bp). 3. What Tq do you use? ANSWER: We use Promega Taq. We use the
cheaper grade. 4. Metaphor agarose is very expensive. Do you reuse it? And if not, why
not? ANSWER: Yes, we reuse the MetaPhor 3 to 7 times (see notes
above on "Economizing"). 5. Do you have any sense of how much resolution is lost if the gel is
run at room temp at half the speed you use? ANSWER: When we run the
gels cold and at high voltage as described above, we can consistently
resolve 6 bp, sometimes 4 bp, and rarely 2 bp. If the gel runs hot, then
bands will often be bowed and distorted and have a lower intensity. The
quality of bands depends to a great extent on the particular primer pair.
With a good primer pair you certainly could run at room temperature or
higher at a lower voltage. 6. Do you know of any reasons why the method would not be useful for
multiplex PCR? ANSWER: We have multiplexed using the same protocol.
You will need to test and optimize primer sets and you will probably need
a base-pair gap of 10 bp. This usually involves changeing relative primer
concentrations, with higher concentrations used for those primers that
amplify the larger product. 7. Can I cast the Metaphor slab and leave it out overnight? Yes, but
refrigerate the slab overnight at 4 degrees. 8. What is the cost per genotype as described in this protocol? Our costs are as follows per single reaction of 10 &#micro;l:
Total genotype cost is therefore $0.23 + DNA preparation/number of
genotypes per case. Labor expense: We assume that one full time technician can carry out
approximately 6 x 96 well plates per day. This includes all data entry. To
achieve this thoughput does require a 96-channel Robinson pipette station.
Therefore to compute total expense you will need to divide the technician
salary by 576. Assume total technical cost of 33K/year (including fringe
etc, assume 48 weeks per year and 5/days per week) = $140/day. This equals
about $0.25 per genotype per day. The cost of personnel and supplies is therefore approximately matched
using our methods. Ways to economize further. 1. Make Taq; 2. Use even cheaper DNA
extraction method. For a current evaluation of genotyping methods see: Weber JL, Broman KW
(2000) Genotyping for human whole-genome scans: past, present, and future.
Adv in Genet 42:7796. Since 15 Oct 1998
|
Neurogenetics at University of Tennessee Health Science Center
| Print Friendly | Top of Page |
Mouse Brain Library | Related Sites | Complextrait.org
