|
|
|
Print Friendly
Elimination of Neurons from the Lateral Geniculate Nucleus of Rhesus
Monkeys during Development
Robert W. Williams and Pasko Rakic
Section of Neuroanatomy, Yale University School of Medicine, 333 Cedar
Street, New Haven CT 06511The Journal of Comparative Neurology 272:424–436 (1988)
 Notes to the reader: This is a revised version of a paper published
in The Journal of Comparative Neurology in 1988. Modifications are delimited
by brackets [...].
Notes to the reader: This is a revised version of a paper published
in The Journal of Comparative Neurology in 1988. Modifications are delimited
by brackets [...].
Enlarging images: Thumbnail versions of all figures are embedded
in the paper. A better image—usually under 100K—will download into a
separate window if you click on the thumbnail image. If you have a large
enough monitor, drag this second figures window beside the text
window. Finally, high-resolution images—usually under 1 MB—that almost match
the quality of the original prints can be downloaded by selecting the text
at the bottom of each legend. These image files can be viewed with Adobe
Photoshop, NIH Image, or equivalent.
Revised HTML edition (http://www.nervenet.org/papers/RHESUS_LGN.html)
copyright © 1998 by
Robert W.
Williams.
| |
|
|
|
Table of Contents
ABSTRACT
The timing, magnitude, and spatial distribution of neuron elimination
was studied in the dorsal lateral geniculate nucleus of 54 rhesus
monkeys (Macaca mulatta) ranging in age from the 48th day of
gestation to maturity. Normal and degenerating cells were counted in
Nissl-stained sections using video-enhanced differential inference
contrast optics and video-overlay microscopy. Before embryonic day 48
(E48), the geniculate nucleus contains 2,200,000 ± 100,000 neurons.
Eight-hundred thousand of these neurons are eliminated over a 50-day
period spanning the middle third of gestation. Neurons are lost at an
average rate of 300 an hour between E48 and E60, and at an average rate
of 800 an hour between E60 and E100. Very few neurons are lost after
E100, and as early as E105, the population has fallen to the adult
average of 1,430,000 ± 90,000. Degenerating neurons are far more common
in the magnocellular part of the nucleus than in the parvocellular part.
In 19 of 27 cases, the number of neurons is greater on the right than on
the left side. The right-left asymmetry averages 8.5% and is significant
(chi-square = 17.7, p <0.02).
The elimination of neurons in the nucleus begins before the depletion
of retinal axons, and this raises the possibility that the number of
geniculate neurons determines the final size of the retinal ganglion
cell population rather than vice versa. The period of cell death
precedes the emergence of cell layers in the geniculate, the
establishment of geniculocortical connections, and the formation of
ocular dominance columns.
[Key words:neuron death, dorsal lateral geniculate nucleus, rhesus
monkey, primate development]
INTRODUCTION
Little is known about the onset, duration, magnitude, or spatial
distribution of neuron elimination in the vertebrate visual system. The
analysis of naturally occurring neuron loss has been difficult because
embryonic neurons are small and are packed together so tightly, and
because the boundaries of visual centers are indistinct at early
developmental stages. In this study we have taken advantage of
video-enhanced differential interference contrast optics (DIC) and
video-overlay microscopy to overcome some of these problems, and using
these methods we have been able to estimate the key parameters of neuron
elimination in the dorsal lateral geniculate nucleus of a primate—the
rhesus monkey, Macaca mulatta—from early in prenatal life through
to maturity.
The simplicity of the retino-geniculo-cortical pathway of macaques
and its similarity to that of humans makes it an excellent system in
which to study interactions that control numbers of neurons in different
parts of the visual system (Rakic and Williams, 1986;
Williams and Herrup, 1988). More than 90% of all retinal ganglion
cells in macaques project only to the lateral geniculate nucleus and
more than 90% of all geniculate neurons project only to primary visual
cortex (Perry et al, 1984; Norden and Kaas, 1978; Hamori et al., 1983;
Pasik et al., 1986). Furthermore, we know when neurons are generated and
when synaptic contacts are established in the visual system of macaques
(Rakic, 1974, 1976, 1977ab; LaVail et al., 1983; Shatz and Rakic, 1981;
Hendrickson and Rakic, 1977; Kostovic and Rakic, 1984; Nishimura and
Rakic, 1985, 1987; Bourgeois and Rakic, 1983). Consequently, changes in
the population of neurons in the geniculate nucleus can now be studied
profitably with respect to other cellular events in development—for
instance, the innervation of the nucleus by retinal and cortical axons,
the elimination of retinal ganglion cells and their axons, the
lamination of the nucleus, the innervation of primary visual cortex by
geniculate fibers, and the development of ocular dominance columns.
MATERIAL AND METHODS
This study is based on an analysis of 54 animals ranging in age from
E48 to maturity. Normal monkey fetuses of known gestational age were
delivered by cesarian section and while anesthetized with Halothane were
perfused through the heart with saline and mixed aldehydes (Rakic,
1972). Postnatal monkeys were anesthetized with sodium pentobarbital and
were perfused with either formalin or mixed aldehydes.
Brains were sectioned serially in the coronal (n = 50) or
horizontal (n = 4) planes, and a minimum of every tenth section
was mounted and stained with cresyl violet or Toluidine blue. Much of
the material was taken from a pre-existing rhesus macaque brain
collection, and because several embedding and cutting protocols had been
used to prepare this material, it was necessary to ensure that the
estimates did not depend on large or small differences in processing.
Four control cases (E61, E66, E128, and P0) were prepared in which right
and left sides of the brain were embedded in different media (celloidin
vs. paraffin, or celloidin vs. a 30% solution of sucrose) and cut at
different thicknesses (20 and 35 µm). Right versus left differences for
this group averaged 11.4% compared to an average difference of 8.9% for
all other material. This difference is not significant. In addition to
these control cases, 11 prenatal brains were embedded only in celloidin
and sectioned at 35 µm (Yakovlev, 1970), while an additional 11 brains
were cut frozen at 30 or 40 µm. Two neonatal brains (P0 and P11) were
were cut in paraffin at 20 µ;m whereas one other neonatal brain (P15)
was cut frozen at 40 µm. All other postnatal brains (n = 18) were
embedded in celloidin and sectioned at 35 µm. Finally, 7 of the youngest
cases (E48, 50, 54, 55, 59, 60, and 70) were embedded in polyester wax
and sectioned at 8 µm (Rakic, 1977). These latter cases were used only
to estimate the fraction of degenerating cells in the thalamus (see
below).
Immunocytochemistry. To corroborate criteria used to
distinguish neurons from glial cells (see Recognition of neurons), we
examined sections of the thalamus immunoreacted with antibodies directed
against glial fibrillary acid protein (GFAP) at three ages—E72, E78, and
E90. Methods and controls used to prepare tissue are described in papers
by Levitt and Rakic (1980) and Levitt et al. (1983). Tissue was cut on a
Vibratome at 60 µm, and sections were incubated for 15 h in a 1:500
dilution of rabbit antiserum and 5% normal goat serum. Avidin-biotin
conjugate and diaminobenzidine were subsequently used to localize GFAP.
Estimation of cell numbers
Direct estimates of neuron number in the geniculate nucleus were
obtained for 47 rhesus monkeys. In 27 of these cases, estimates were
obtained from both sides, and the means of right and left sides were
used in all subsequent calculations. The accuracy of the estimates
depends crucially on five factors:
- the recognition of neurons
- the accuracy of counting
- the precision of estimates of geniculate volume
- the sampling procedure
- the correction factors used to compensate for the split cell
effect (see Konigsmark, 1970).
The procedures and problems associated with each of these factors are
considered below.
Recognition of neurons. Counts were performed at a final
magnification of x2500 using a x100 oil immersion objective and
video-enhanced DIC optics (Inoue, 1986). The following morphological
criteria were used to distinguish neurons from glial cells, endothelial
cells, and pericytes:
- Nuclei of neurons have prominent nucleoli and smooth nucleoplasm,
whereas glial cells and pericytes usually have small, dark nucleoli,
scattered clumps of heterochromatin, and rough nucleoplasm (Ling et
al., 1973)
- Neurons contain more abundant and more granular Nissl substance
than other cell types.
- Cell bodies and nuclei of neurons typically have cross-sectional
areas two to three times larger than those of glial cells even at
early developmental stages. Although local circuit neurons are only
slightly larger than glial cells, they have prominent nucleoli that
set them apart from glial cells.
- Nuclei of neurons are round or oval whereas those of glial cells
are irregularly shaped, often with sharp indentations. Pericytes and
endothelial cells are oblong or crescent-shaped, have densely stained
chromatin, and are associated with capillaries. Between E61 and E78
the distinction between neurons and other cell types, although less
obvious than in late fetal and neonatal material, could be made
accurately in the majority of cases (Figs 1, 2).
We consider problems associated with the distinction of cells during
this period, and how these problems may affect the interpretation, in
the Results section.
Accuracy of counting. The number of neurons in a single
counting frame ranged from 5 to 250. Neurons were counted if they were
completely within the margins of the frame or if they intersected only
its upper or right sides (Gundersen, 1977). Even at a magnification of
2500, it is possible to miss 10% of the cells, particularly when the
packing density is high. To improve the accuracy of counting we have
used video-enhanced DIC optics in combination with a video-overlay
system. A camera (Hamamatsu C2400) was mounted on the microscope, and
the field of cells was viewed on a video monitor (Sony PVM-1271Q). The
outlines of each cell (nucleus or nucleolus) were traced at x2500 on the
screen of the monitor using a digitizing tablet as an input device.
Because cells were marked and measured on the monitor, errors of
omission and commission were easily detected and corrected.
Estimation of the total volume. Outlines of the geniculate
nucleus were drawn and measured at evenly spaced intervals through the
entire nucleus. The length of the nucleus orthogonal to the cutting
plane was estimated by multiplying the mean section thickness by the
number of sections, and the total volume was calculated by multiplying
the average area by the length.
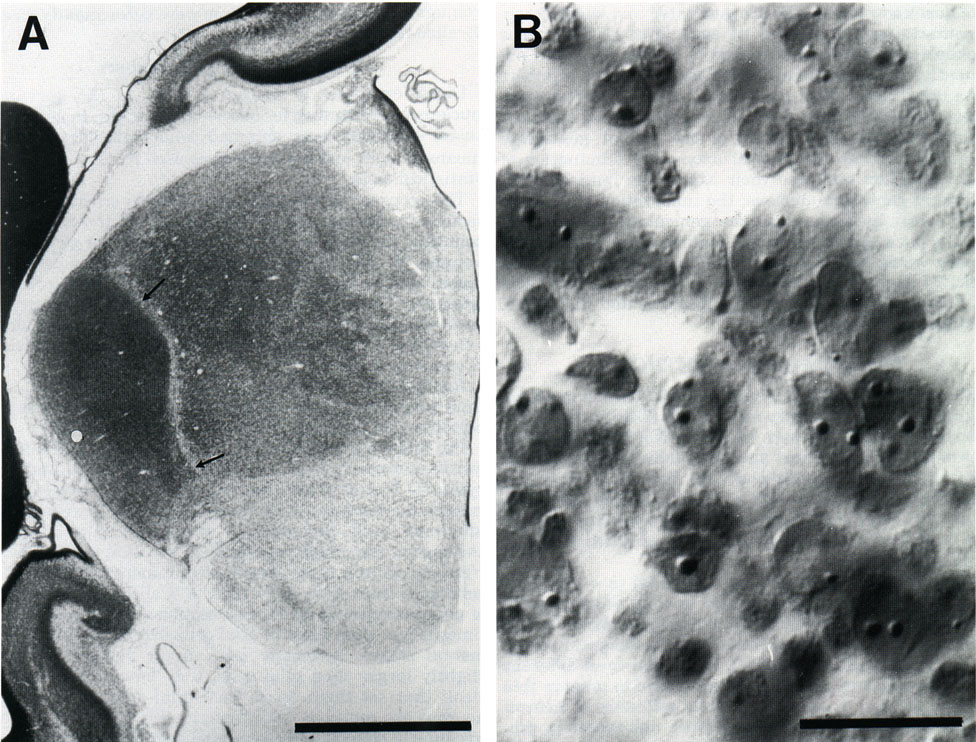
Figure 1: Photomicrographs of the posterior thalamus on the 66th
day of gestation. (A) Low magnification view of a coronal section cut
through the thalamus. The dorsal lateral geniculate nucleus is clearly
separated from adjoining thalamic nuclei at this age (two small arrows)
. (B) Appearance of cells in the geniculate nucleus close to the pial
margin (see the location of the small white spot in A viewed with DIC
optics at approximately the same magnification as used to count. The
depth of focus of this view is less than 0.5 µm. Because the section is
35 µm thick, many more neurons were counted per field than can be seen
at any one plane of focus. For this reason the video-overlay system (see
Material and Methods) was necessary to keep track of counted and
uncounted cells.
Sampling procedures. The density of neurons in the geniculate
nucleus varies with position. Neurons are scattered more widely in the
interlaminar zones than within the cell layers, and cell densities are
lower in magnocellular layers than in parvocellular layers even as early
as E86. In contrast, there are only negligible regional differences
within layers. However, because the overall laminar makeup of the
nucleus—that is, the combination and spacing of layers present in any
given section—differs from front to back or from top to bottom (Kaas et
al., 1978), and because of differences in the distribution of fibers of
passage, there are rostrocaudal gradients in cell packing density. For
instance, the mean difference along the rostrocaudal axis varies from 15
to 30% in postnatal animals (Kupfer et al., 1967).
To get a balanced sample, all layers were examined in a series of
fields extending from the ventral-most layer (layer 1 or the superficial
layer S) through to layer 6 at three or more levels. The difference
between our standard sampling method (one translaminar probe per
section, typically three to six sections examined per nucleus) and a
more extensive, uniform sampling procedure (up to 10 probes per section,
8 to 10 sections examined per nucleus) was under 10%.
Correction factor. The counts were corrected using Floedrus' equation
Ncor = Nraw x [t/(t + S - 2b)] |
| |
|
|
|
Figure 2. Plot of neuron number from E61 to
maturity in the dorsal lateral geniculate nucleus. Each point represents
a single animal, and in those cases in which both nuclei were counted,
the average value is plotted. As early as E105, the neuron population is
in the middle of the adult range. Adult values have been spread slightly
in the horizontal axis. Compare this figure with Fig. 8, which shows how
the changes in neuron number correspond to other phases of visual system
development in the rhesus monkey.
(summarized in Konigsmark, 1970; his equations 3 and 4), where
Ncor and Nraw are the corrected and raw number of neurons;
t is the thickness of the section; S is the mean diameter of the
population of nuclei in the axis perpendicular to the plane of the
section; and b is an estimate of the size of the lost polar cap.
In celloidin material, t—the thickness of individual sections—was
measured at a resolution of 0.5 µm at several sites along each probe. In
frozen and paraffin material, the microtome setting was used as an
estimate of t. b—a value used to estimate the size below
which the criterion structure can not be seen—was set at 1 µm (see
Konigsmark, 1970).
The standard deviation of the set of counts per probe was used to
compute a 95% confidence interval for each estimate. Data were entered
into a computer (Macintosh II) and all calculations and corrections were
performed automatically using a spreadsheet program (Microsoft Excel).
Counting and plotting degenerating cells. In Nissl-stained
tissue, degenerating cells, appear as dark, uniformly stained blobs
(Fig. 6). They look like ink spots, and are often surrounded by pale
halos. Their appearance does not depend to any significant degree on
embedding method or fixation quality. For purposes of counting, a site
of cell degeneration was defined as a region with a diameter of 10 to 15
µm containing between one and ten darkly stained blobs each with an
diameter between 0.5 and 4.0 µm. We counted and plotted these pyknotic
sites in a minimum of eight sections through the geniculate nucleus
using a 63X oil immersion objective. After making corrections for
differences in the areas of these sections, we calculated the incidence
of cell degeneration for the entire nucleus. The issue of the identity
of degenerating cells is taken up in the next section.
Figure 3. Examples of glial cells and neurons at E78 to illustrate the
criteria used for classification of cells. A. Glial cells in the optic
tract just below the geniculate nucleus photographed in 35 micron-thick
celloidin tissue with DIC optics on the 78th day of gestation. As
described in Material and Methods, glial cells are smaller and have less
distinct nucleoli than do neurons. B. Neurons and several glial cells
(small arrows) within the geniculate nucleus. Scale bar represents 10
µm.
Figure 4. Anti-glial fibrillary acid protein antibody (GFAP) labeling of
the dorsal thalamus at E78; DIC optics. (A) Immunoreactivity within the
geniculate nucleus is light. Few processes and even fewer cell bodies
are labeled. In this micrograph only a single labeled astrocyte is
visible (small arrow). (B). In contrast, the immunoreactivity is intense
in other parts of the thalamus—in this case in a region just a few
hundred micron above the geniculate nucleus. Many astrocytes are GFAP-positive.
Scale bar represents 250 µm.
RESULTS
Rise and fall of neuron number. All geniculate neurons are
generated before E45 and have completed their migration by E50 (Rakic,
1977a). As early as the E60s, the boundaries of the geniculate nucleus
can be recognized (Fig. 1A) and consequently, the total number of cells
can be estimated accurately. At this age, the prospective magnocellular
layers are located close to the ventral and lateral surface of the
nucleus (Fig. 1B); the parvocellular layers are more dorsal and medial (Rakic,
1977a). With the exception of a few small, darkly stained pericytes,
endothelial cells, and a thin layer of subpial glia, cells are uniform
in size and appearance (Fig 1B). Direct estimates of neuron number were
obtained from a total of 72 nuclei from 45 animals between the ages of
E61 and maturity. We have been able to obtain estimates of neuron number
in younger animals only by indirect methods (see Analysis of
degenerating cells).
At E61 and E66 there are between 2,000,000 and 2,200,000 neurons in
the nucleus (Fig. 2). The number of glial cells, pericytes, and
endothelial cells at this stage is low (see below), and consequently
these figures do not significantly over- or underestimate the total
neuron population. Comparisons of the cytological characteristics of
glial cells in the optic tract (Fig. 3A) with the major class of cells
in the nucleus (Fig. 3B) reveal clear differences between neurons and
glia. The nuclei of cells in the geniculate considered to be neurons are
ovoid and contain up to 6 distinct nucleoli. In contrast, glial cells in
the optic tract, and cells suspected to be glial cells in the geniculate
nucleus, generally have irregularly shaped nuclei and either have no
visible nucleoli or have peripheral nucleoli and heterochromatin typical
of astrocytes (Ling et al., 1973). Using these criteria the number of
glial cells within the geniculate nucleus from E66 through E78 is
estimated to be under 100,000.
A further confirmation of the small number of glial cells in young
fetuses comes from the analysis of the tissue reacted with antibodies
directed against GFAP (Fig. 4). Examination of the E72, E78, and E90
tissue reveals that few cells carry this glial marker at these ages.
Although the ventral and medial diencephalon contains immunolabeled cell
bodies and heavily stained radial glial fibers (also see Levitt and
Rakic, 1980), there are remarkably few labeled cells or processes in the
geniculate nucleus of the same sections. Although the limitations of
immunocytochemical methods preclude a detailed quantitative analysis,
the fraction of labeled cells appears to be under 5%.
Neuron number in the geniculate nucleus remains well above the adult
range as late as the E90s (Fig. 2). For purposes of statistical
comparison, we have grouped all fetuses between E61 and E100 together:
the average number of neurons in the lateral geniculate in this group of
animals is 1,870,000. The 95% confidence interval of this average is ±
90,000 neurons (n=13). The range is greater because of the systematic
reduction in neuron number with age and because of the natural variation
between individuals.
In the group of animals between E105 and E165, the lateral geniculate
contains 1,445,000 ± 60,000 neurons (n=11). During this two-month period
there is no evidence of any gradual reduction in neuron number.
Likewise, between birth and 30 days the geniculate nucleus contains a
similar number of neurons: an average of 1,570,000 ± 104,000 (n=7).
Finally, in juveniles and mature adults the average number of neurons is
1,420,000 ± 87,000 (n=10).
As mentioned above the variation in the number of neurons in the
nucleus within an age group may be substantial. For instance, at birth
estimates range from 1,350,000 to nearly 1,800,000. The average
confidence interval of ± 12% suggests that at least part of the
variation is inherent in the counting procedure. Nonetheless, true
individual differences also appear to be an important source of
variation. Increasing the number of probes per nucleus to reduce
sampling errors does not appreciably reduce the range of estimates.
Right-left asymmetry. In 19 of 27 animals in which both nuclei
were counted, the right side contained more neurons. The probability of
obtaining a 19 to 8 distribution by chance is 0.05 (two-tailed binomial
probability). The bias for 10 adults was 8 right versus 2 left. The bias
for 4 fetuses during the period of neuron loss (E61 to E100) was 3 right
versus 1 left. A review of our procedure and the sequence of data
collection revealed no likely source of bias (e.g., order of counting
left and right sides, etc.). Furthermore, since we did not notice the
right-side bias in our set of data until after all 54 of these nuclei
had been counted, it is unlikely that the bias was introduced during
counting.
The magnitude of the right-left differences was greater than 5% in
all but two cases (Fig. 5). The average difference between right and
left nuclei, irrespective of whether right or left contained more
neurons was approximately 150,000 neurons (8.5%). However, the
cumulative right bias for all animals was 3.26% and the standard
deviation was 9.12%. If this right/left differences were due to small
scale variation around a true mean of zero (see Fig. 5), then it would
be expected that observations cluster near the 0% point. The data
clearly suggest otherwise. Statistical analysis using the chi-square
test for goodness of fit demonstrates that the observations do not
belong to a population with a normal distribution and with equal numbers
of neurons in each nucleus (c2= 17.7 and p less than .02; tested using
classes of half a standard deviation).
Analysis of dying cells
Number of dying cells. To estimate how many neurons are lost
before E60, we counted and plotted degenerating cells in and around the
geniculate nucleus between E48 and E60. Even as early as E48, the
geniculate nucleus can be easily recognized, although its medial border
is indistinct. To complement this analysis we also determined the number
and distribution of degenerating cells in several of the older fetal
tissue for which neuron counts had been obtained. We are confident that
at early the majority of dying cells at early stages of development are
in fact neurons and not glial cells or pericytes. The sites of necrosis
are often large, they are unevenly distributed, and they are most
abundant during the period when neuron number is dropping most rapidly.
Furthermore, there are very few degenerating cells in the optic tract
and optic radiations before E90, suggesting that the rate of glial
degeneration in the nucleus is probably low. However, in older fetal
material and in neonates, the incidence of cell degeneration in the
optic tract and optic radiations is high (see Williams and Rakic, 1985,
for a note on the problem of dying glial cells at late stages of
development). For this reason we did not undertake any quantitative
analysis of necrosis in the geniculate nucleus in animals older than
E90. |
| |
|
|
Figure 5. Right-left asymmetry of neuron number
in the geniculate nucleus of 27 animals for which both sides were
counted. In 19 animals the right nucleus had more neurons, in the other
8 the left nucleus had more neurons. Binomial and chi-square tests (see
Results) reveal that this distribution is significantly different from
that expected from sampling a population with a normal distribution and
a mean right-left difference of 0%.
The incidence of cell necrosis is highly variable in young fetuses.
Three- or four-fold differences are not uncommon between animals that
are separated in age by only a few days (Table 1). It is unlikely that
this variability is due to to fixation or tissue processing because the
number of dying cells on left and right sides were within 35% of each
other, even when the sides had been processed differently. Furthermore,
we consistently observed concentration of degenerating cells in the same
parts of the nucleus in different fetuses. 1 One likely source for this
variation may be differences in the time required to clear away
degenerating cells. An increase in the clearance time will give rise to
an increase in the incidence of degeneration even if the rate of
necrosis is constant. While we cannot estimate variation in the
clearance time, we can estimate the average clearance time. About
800,000 neurons are eliminated between E60 and E100, or about 800 per
hour. If the clearance time were exactly 1 hour we would expect each
nucleus to contain 800 necrotic sites. In fact, nuclei typically had
half again as many necrotic sites (1200 sites or 1 site per 1,500 normal
neurons). Thus, the average clearance time over this 40-day period is
probably in the neighborhood of 1.5 hours.
Table 1. Highly Variable Incidence of Cell Degeneration
|
| |
Number of degeneration sites |
| AGE * |
per 100,000 normal neurons |
|
| E48 |
11.10 |
| E50 |
4.05 |
| E54 |
0.83 |
| E55 |
2.50 |
| E59 |
0.77 |
| E60 |
4.00 |
| E61 |
1.17 |
| E66A right |
7.76 |
| E66A left |
8.00 |
| E66B |
12.20 |
| E68 |
3.70 |
| E70A |
20.00 |
| E70B right |
19.80 |
| E70B left |
27.00 |
| E72 |
7.60 |
| E78 |
16.00 |
| E86A |
6.90 |
| E86B |
12.50 |
| E87 right |
15.40 |
| E87 left |
9.10 |
|
| * A's and B's refer to different animals of
the same gestational age. |
|
|
The estimate of the number of neurons eliminated before E60 is based
on (1) the average incidence of cell degeneration in the anlage of the
geniculate nucleus from E48 to E60—about 1 in 4,000, and (2) the average
incidence of cell degeneration from E61 to E90—about 1 in 1,500. Since
the incidence of dying cells between E48 and E60 is only a third that
between E61 and E90, it is likely that only 250 to 300 neurons are lost
each hour during the earlier phase of cell loss. Additional cells may be
lost even before E48, perhaps while migrating toward the lateral margins
of the diencephalon, but it is unlikely that this loss would exceed
6,000 to 8,000 cells per day. Therefore, the cumulative loss of neurons
from the end of neurogenesis (ca. E45) to E60 is in the neighborhood of
50,000 to 100,000.
Distribution of degenerating cells
The distribution of pyknotic cells in the geniculate nucleus is
remarkably uneven. In the youngest animals—E48 and E61—the majority of
dead cells are located within 100 µ;m of the lateral margin of the
nucleus. This area consists mainly of the first generated geniculate
neurons, many of which are eventually situated in the magnocellular
layers (Rakic '77a). The focus of cell death shifts during the E60s: In
virtually every specimen examined between the ages of E66 and E80, a
substantial majority of the dead cells are situated in the ventromedial
sector of the nucleus (Fig. 6B). In several cases, including that
illustrated in figure 6, more than 80% of the degenerating cells are
restricted to the ventromedial sector, which makes up less than 20% of
the nucleus. The incidence of necrosis reaches extremely high levels—1
dead cell among 50 normal neurons—an incidence unequaled anywhere else
in the diencephalon except the midline nuclei of the posterior thalamus.
In marked contrast, the incidence of dying cells in the much larger
dorso-lateral part of the nucleus, the parvocellular moiety, is
generally under 1 in 10,000.
In cases examined between E80 and E90 the greatest incidence of
necrosis is also found in the ventral part of the nucleus, but during
this period the entire medio-lateral margin of the nucleus is involved
(Fig. 7). This ventral region is made up of the magnocellular layers and
the thin, almost vestigial, S layers. The cumulative incidence of
necrosis within the magnocellular sector of the nucleus over the entire
period from E48 to E100 is as much as 10-fold higher than the incidence
in the parvocellular layers.
DISCUSSION
Time and magnitude of neuron loss
We have shown that the dorsal lateral geniculate nucleus of fetal
rhesus monkeys contains approximately 2,200,000 neurons—800,000 more
than adults. The 36% excess is eliminated over a 50-day period that ends
more than 2 months before birth. Given the substantial qualitative and
quantitative similarity of the visual systems of rhesus monkeys and
humans, it is likely that a similar number of neurons are eliminated
from the human lateral geniculate nucleus toward the end of the first
trimester (see footnote 2).
A comparison with cell loss in mice and hamsters
Neuron number in the geniculate nucleus has been studied previously
only in postnatal rodents. In mouse, the population drops from 24,000 at
birth to 17,000 at one month (Heumann and Rabinowicz, 1980). An
equivalent loss has also been reported in rats (Matthews et al.,'82;
Satorre et al., 1986). However, there is no consensus on the rate or
exact timing of this loss: Heumann and Rabinowicz report a gradual
decline, while Satorre et al. report an initial rise from birth to P10
followed by a rapid decline. To add further complexity, two waves of
cell death have been described in another rodent, the hamster, one on
the fifth day and one on the eighth day (Sengelaub et al.,'85). The
differences in the kinetics of neuron loss in these rapidly developing
species has made it difficult to correlate the loss with other events in
the development of the rodent visual system. It is interesting, and
perhaps significant, that the percentage of neurons lost in rodents and
primates is close, despite the fact that the primate geniculate is a
much more highly differentiated structure (Balado and Franke, 1937;
Dreher et al., 1976; Kaas, et al., 1978, Schiller and Malpeli, 1978;
Marrocco et al., 1982). Given the wealth of information on the
development of the visual system of the domestic cat (e.g., Chalupa and
Williams, 1985; Shatz and Sretavan, 1986; Williams et al., 1986), it
would be of considerable interest to determine key parameters of neuron
elimination in this species' geniculate nucleus.
Figure 6. Necrotic cells in the dorsal lateral geniculate nucleus
at E66. These degenerating cells were located in the ventro-medial part
of the nucleus in section 20 of figure 7A.
It is important to avoid making the tacit assumption that dying
neurons in the geniculate nucleus are all principal neurons with real or
potential projections into the telecephalon. Many dying cells may be
local circuit neurons. In the mouse cerebellum, for instance, the number
of local circuit neurons (granule cells) is reduced about 30% during the
first postnatal month, whereas the number of principal neurons (Purkinje
cells) is not reduced at all (Caddy and Biscoe, 1979). In our own work,
we have counted the entire neuron population because we could not
reliably distinguish between types of neurons. While there are few local
circuit neurons in the adult rhesus monkey's geniculate nucleus (Norden
and Kaas, 1978; Hamori et al., 1983; Pasik et al., 1986, cf. Montero and
Zempel, 1986) this obviously may not be true early in development. One
piece of evidence we have that bears on the identity of degenerating
cells is their very high frequency in prospective magnocellular layers.
In the adult rhesus these layers actually contain twice as many local
circuit neurons as parvocellular layers (Pasik et al., 1986)—a pattern
opposite what one would predict if a substantial number of dying cells
were local circuit neurons. This interesting problem might be addressed
directly by performing a quantitative analysis of sections of prenatal
geniculate nucleus stained with antibodies directed against GABA (e.g.,
Shotwell et al., 1986), the transmitter used by local circuit neurons in
the mammalian geniculate nucleus.
Quantitative asymmetry of the primate LGN
The average surplus of 150,000 neurons in the right lateral
geniculate of 70% of the animals we studied could result from unequal
production of neurons in left and right halves of the brain or it could
result from unequal loss of neurons in two nuclei. In theory the merits
of these alternatives could be tested by studying animals before neurons
died and by determining whether the incidence of necrosis is asymmetric.
Unfortunately, at his point we do not have enough information to address
this problem. One clear implication of the right side bias is that the
number of geniculate neurons subserving the left visual hemifield will
often be more than 5% greater than the number subserving the right
hemifield. Williams and Herrup (1988) have reviewed the relationship
between neuron number and function, and they point out that even large
differences in neuron number often fail to give rise to detectable
behavioral differences. For this reason, it is unlikely that routine
tests would reveal any consistent difference. However, if the asymmetry
seen in the lateral geniculate nucleus is matched by an equal or even
greater asymmetry in primary visual cortex (R.W. Williams, K. Ryder, and
P. Rakic, in progress), then there will be more of a basis for studying
the possible functional significance of this finding.

Figure 7. Distribution of degenerating cells in coronal sections
through the dorsal lateral geniculate nucleus at E66 (7A) and at E87
(7B). At E66 the majority of pyknotic cells are located in the ventro-medial
part of the nucleus. This distribution characterized the geniculate
nucleus between E60 and E80. At E87 the majority of dying cells are
located in the ventral part of the nucleus made up of magnocellular
layers 1 and 2. In the caudal-most section of 7B, the magnocellular
layers are oriented in the dorsoventral axis on the medial side of the
nucleus.
Timing of cell death in the geniculate nucleus and the retina
A major finding of the present study is that neuron death in the
geniculate nucleus starts as early as E48, long before there is evidence
of any reduction in ganglion cell number (Rakic and Riley, 1983). In
fact, at the time neuron loss begins in the geniculate, only half of the
population of retinal ganglion cells has yet been generated (LaVail et
al., 1983; Rakic and Riley, 1983) and few if any optic axons have grown
into the nucleus (Williams and Rakic, 1985). Therefore, neuron
elimination in the geniculate nucleus cannot result from cell death in
the retina (Fig. 8). Instead the reverse may be true: the number of
geniculate neurons may regulate the survival of ganglion cells. A 30% to
40% reduction in the number of geniculate neurons may trigger the 50% to
60% reduction in the number of retinal ganglion cells.
A retrograde pattern of control of neuron number may be most
pronounced in the visual system of species, such as Macaca mulatta, in
which a very high percentage of retinal ganglion cells project
exclusively to the lateral geniculate nucleus (Perry et al., 1984).
Experimental studies in fetal and neonatal primates support this idea.
Ablations of primary visual cortex before birth or in infancy cause a
rapid and near total loss of geniculate neurons, and this loss has swift
retrograde effects on retinal ganglion cells: 70% to 80% of these cells
die (Weller et al., 1979; Dineen and Hendrickson, 1981; Ogren et al.,
1984). The present results and data of Rakic and Riley (1983), indicate
that the dependence of retinal ganglion cells on geniculate neurons may
develop as early as E80—about a week after the last retinal ganglion
cells have been generated (LaVail et al., 1983).
|
| |
|
|
Figure 8. Schematic representation of the timing
of major processes in the development of the primary visual pathway in
the rhesus monkey based on the results of this study, Rakic (1976,
1977a, 1977b), and Rakic and Riley (1983a). A particularly important
observation is that the loss of neurons in the geniculate nucleus (black
line) is essentially complete by the time the number of optic axons in
the nerve begins to fall (gray line).
The sensitivity of ganglion cells to a reduction in the number of
geniculate neurons is not matched by an equal sensitivity of geniculate
neurons to a reduction in the number of ganglion cells. Although the
removal of one eye early in development causes a 50% drop in the number
of retinal axons innervating the geniculate nuclei, there is no evidence
for any substantial reduction in the number of geniculate neurons (P.
Rakic and R.W. Williams, in progress). The independence of geniculate
neurons to a substantial loss of retinal axons may be due to the major
projections the nucleus gets from cortex and brainstem.
Neuron death and lamination.
The development of cell layers in the geniculate begins around E85
and is complete by about E110 (Fig. 8). If lamination involved the
selective loss of neurons, one would anticipate that neuron loss would
continue after E100, and one would anticipate that neuron loss would be
as common in parvocellular as in magnocellular parts of the nucleus.
Neither of these predictions is correct, and consequently, the formation
of laminae is evidently not associated with appreciable neuron death.
Lamination is probably caused by the growth and redistribution of cells,
dendrites, and fibers.
Neuron death and the formation of retinotopic maps
There is good evidence that the formation of retinal projections
involves the selective elimination of ganglion cells that make incorrect
connections (McLoon, 1982; Insausti et al., 84; Jeffery, 1984; O'Leary
et al., 1986; Jacobs et al., 1984, Rakic, 1981; Rakic and Riley, 1983;
Williams et al., 1983; Rakic, 1986). In marked contrast, our results
demonstrate that neuron number in the geniculate nucleus is stable
during the entire period from E110 to E140 when geniculate axons grow
into the cortical layers and establish the geniculocortical projection
(Fig. 8). It is evident that this precise retinotopic projection is
established without the the benefit of cell loss. Thus at the level of
retina and its targets, the refinement of connections appears to be
achieved in part by the selective elimination of incorrectly connected
subsets of ganglion cells, whereas at the level of the geniculate
nucleus and its target, the refinement is achieved without any neuron
loss. [Footnote 3.]
Neuron loss and the development of ocular dominance columns
The segregation of ocular dominance stripes in the primary visual
cortex of the rhesus monkey begins during the last month of gestation
and is complete two months after birth (Rakic '76; Hubel et al., 1977;
LeVay et al., 1980). LeVay and Stryker (1978) have illustrated arbors of
individual Golgi-impregnated geniculocortical axons in neonatal cat that
extend uniformly over territories that in adults would occupy several
ocular dominance stripes. On the basis of this finding they concluded
that segregation results from "synchronous changes in the arborizations
of thousands of overlapping geniculocortical axons." Their result does
not rule out an alternative, namely, that the refinement is attributable
to the selective elimination of geniculate neurons that make incorrect
connections. Because, segregation occurs long after the period of neuron
death in the geniculate nucleus, we can now rule out this alternative.
Positional specificity of neuron loss
Degenerating cells in the fetal monkey geniculate nucleus are located
principally in ventral and ventro-medial parts of the nucleus. This zone
overlaps extensively with the prospective magnocellular layers. In
contrast, cell loss is light in the dorsal part of nucleus that gives
rise to the four parvocellular layers. There are several possible
interpretation of this finding:
- Ratios between the two major types of projection neurons in the
geniculate nucleus (magnocellular Y-type and parvocellular X-type) may
be adjusted by the elimination of young magnocellular neurons. An
effective way to adjust ratios would be to eliminate members of the
less numerous cell class—in this case the magnocellular Y-type
neurons.
- The spatial segregation of the two major neuron classes may
involve the selective elimination of magnocellular Y-type cells
located in the parvocellular layers and of parvocellular X-type
neurons located in the magnocellular layers. However, it is important
to note that the segregation of cell types in the adult monkey is far
from perfect. About 1 in 50 neurons recorded in the parvocellular
layers is Y-type (Marrocco, 1982) and according to Shapley et al.
(1981) as many as 3 out of 4 cells in the magnocellular layers are
X-type.
- The focus of necrosis in the ventral region may reflect the
elimination of a transient population of S-type neurons. This idea is
based on a suggestion of Kaas and colleagues (1978) that the ventrally
situated S layers are regressive in several primate species, including
rhesus macaques.
- The ventro-medial bias in the incidence of cell degeneration
suggests that more neurons may die in the region that represents the
periphery of the visual field (eccentricities greater than 15 degrees)
than in the dorsocaudal region that represents the center of the
visual field (Malpeli and Baker, 1975). Sengelaub et al. (1985) have
previously reported that the loss of geniculate cells in hamsters in
greatest in a region that represents the periphery of the
contralateral visual hemifield.
Experimental and comparative approaches would be effective in testing
the validity of these ideas.
Neuron death and the cortical target
The dependence of young neurons on their target cells has been
demonstrated in several systems (reviewed by Hamburger and Oppenheim,
1982; Williams and Herrup, 1988). For instance, in the retinogeniculate
system, the reduction in neuron number in the central target—the
geniculate nucleus—may initiate a reduction in the number of neurons in
retina. This notion that the survival of retinal ganglion cells depends
on the number of geniculate neurons stands in contrast to the
somatosensory system, in which there is reason to believe that the
survival of the central neurons depends on the status of the periphery
(Johnson et al., 1972; Rowe, 1982; van der Loos and Welker, 1985).
Is the loss of geniculate neurons also regulated by interactions with
target cells? The principal targets of these thalamic neurons are cells
in striate cortex—stellate cells of layer IV, ascending dendrites of
layer V and VI pyramidal cells, and descending dendrites of layer III
pyramidal cells (Garey and Powell, 1971; Peters, et al., 1979; White,
1979). At the time the loss begins (ca. E48), only those cortical
neurons destined for the deep layers V and VI are being generated,
whereas the stellate cells of layer IVC and the pyramidal cells of layer
III are not generated until after E66 (Rakic, 1974). All these young
neurons migrate up into the cortical plate after passing through a
plexus of geniculate axons situated in the optic radiations and the
subplate (Rakic, 1977b). While contacts between geniculate axons and
migrating neurons during this period have not been demonstrated yet (Kostovic
and Rakic, 1980; Chun et al., 1987), it is nonetheless possible that
interactions between the two modulate the severity of neuron loss in the
thalamus; and it may be more than just coincidental that the period of
heaviest neuron death occurs when layer IV neurons migrate through the
plexus of geniculate axons. Interactions between thalamic axons and
young cortical neurons certainly exercise strong control over the size
and number of neurons in the visual cortex of primates. We have been
able to demonstrate that reducing the number of geniculate neurons
causes a matched reduction in the number of neurons in visual cortex (Rakic
and Williams, 1986). Work in progress suggests that the critical period
for this type of manipulation extends from E60 to E100, almost precisely
the period during which cortical neurons are migrating through the
subplate and the plexus of geniculate axons.
ACKNOWLEDGMENTS
We thank Kathryn Ryder for helping us perform the analysis; Dr.
Patricia Goldman-Rakic for providing us with tissue; and Dr. Prabhat
Sehgal for surgery and acquisition of fetuses of known gestational age.
Supported by grant EY 02593 to PR. The fetuses were obtained through the
primate breeding colony (Yale University School of Medicine) supported
in part by program project NS 22807, and from the New England Regional
Primate Research Center, Southboro, MA.
LITERATURE CITED
Balado, M., and E. Franke (1937) Das Corpus Geniculatum Externum.
Eine anatomisch-klinische Studie. Monographien aus dem Gesamtgebiete der
Neurologie und Psychiatrie 62:1–118.
Bourgeois, J.-P., and P. Rakic (1983) Synaptogenesis in the primary
visual cortex: Quantitative analysis in pre- and postnatal rhesus
monkeys. Soc. Neurosci. Abst. 9:692.
Caddy, K.W.T., and T.J. Biscoe (1979) Structural and quantitative
studies on the normal C3H and Lurcher mutant mouse. Phil Trans. R. Soc.
Lond. B. 287:167–201.
Chacko, L.W. (1948) The laminar pattern of the lateral geniculate
body in the primates. J. Neurol. Neurosurg. Psychiat. 11:211–224.
Chalupa, L.M., and R.W. Williams (1985) Formation of retinal
projections in the cat. In. R.N. Aslin (ed): Advances in Neuronal and
Behavioral Development. vol. 1. Norwood, New Jersey: Ablex Publishing,
pp. 1–32.
Chow, K.L., J. S. Blum, and R.A. Blum (1950) Cell rations in the
thalamo-cortical visual system of Macaca mulatta. J. Comp. Neurol.
92:227–239.
Chun, J.J.M., M.J. Nakamura, and C.J. Shatz (1987) Transient cells of
the developing mammalian telencephalon are peptide-immunoreactive
neurons. Nature 325:617–620.
Dineen, J.T., and A.E. Hendrickson (1981) Age-correlated differences
in the amount of retinal degeneration after striate cortex lesions in
monkeys. Invest. Ophthalmol. Vis. Sci. 21:749–752.
Dreher, B., Y. Fukada, and R.W. Rodieck (1976) Identification,
classification and anatomical segregation of cells with X-like and
Y-like properties in the lateral geniculate nucleus of Old-World
primates. J. Physiol. 258:433–452.
Garey, L.J., and T.P.S. Powell (1971) An experimental study of the
termination of the lateral geniculo-cortical pathway in the cat and
monkey. Proc. R. Soc. Lond. (B) 179:41–63.
Gundersen, H.J.G. (1977) Notes on the estimation of numerical density
of arbitrary profiles. The edge effect. J. Microsc. 111:219–223.
Hamburger, V., and R.W. Oppenheim (1982) Naturally occurring neuronal
death in vertebrates. Neurosci. Comm. 1: 39–55.
Hamori, J., P. Pasik, and T. Pasik (1983) Differential frequency of
P-cells and I-cells in magnocellular and parvocellular laminae of monkey
lateral geniculate nucleus. An ultrastructural study. Exp. Brain Res.
52:57–66.
Hendrickson, A.E., and P. Rakic (1977) Histogenesis and
synaptogenesis in the dorsal lateral geniculate nucleus (LGd) of the
fetal monkey brain. Anat. Rec. 187:602.
Heumann, D., and T. Rabinowicz (1980) Postnatal development of the
dorsal lateral geniculate nucleus in the normal and enucleated albino
mouse. Exp. Brain Res. 38:75–85.
Hubel, D.H., T.N. Wiesel, and S. LeVay (1977) Plasticity of ocular
dominance columns in monkey striate cortex. Phil. Trans. R. Soc. Lond. B
278:377–409.
Inoue, S. (1986) Video Microscopy. Plenum Press. New York.
Insausti, R., C. Blakemore, and W.M. Cowan (1984) Ganglion cell death
during development of ipsilateral retino-collicular projections in
golden hamster. Nature 308:362–365.
Jacobs, D.S., V.H. Perry, and M.J. Hawken (1984) The postnatal
reduction of the uncrossed projection from the nasal retina in the cat.
J. Neurosci. 4:2425–2433.
Jeffery, G. (1984) Retinal ganglion cell death and terminal field
retraction in the developing rodent visual system. Dev. Brain Res.
13:81–96.
Johnson Jr., J.I., T.C. Hamilton, J-C. Hsung, and P.S. Ulinski (1972)
Gracile nucleus absent in adult opossums after leg removal in infancy.
Brain Res. 38:421–424.
Kaas, J.H., M.F. Huerta, J.T. Weber, and J.K. Harting (1978) Patterns
of retinal termination and laminar organization of the lateral
geniculate nucleus of primates. J. Comp. Neurol. 182:517–554.
Konigsmark, B.W. (1970) Methods for the counting of neurons. In:
W.J.H. Nauta and S.O.E. Ebbesson, Contemporary Research Methods in
Neuroanatomy. New York, Springer-Verlag. pp.315–340.
Kostovic, I.M, and P. Rakic (1980) Cytology and time of origin of
interstitial neurons in the white matter in infant and adult human and
monkey telencephalon. J. Neurocytol. 9:219–242.
Kostovic, I.M., and P. Rakic (1984) Development of prestriate visual
projections in the monkey and human fetal cerebrum revealed by transient
cholinesterase staining. J. Neurosci. 4:25–42.
Kupfer, C., L. Chumbley, and J. De C. Downer (1967) Quantitative
histology of optic nerve, optic tract and lateral geniculate nucleus of
man. J. Anat. 101:393–401.
LaVail, M.M., D. Yasumura, and P. Rakic (1983) Cell genesis in the
rhesus monkey retina. Invest. Ophthalmol. Vis. Sci. 24:7.
LeVay, S., and M.P. Stryker (1978) The development of ocular
dominance columns in the cat. In: Aspects of Developmental Neurobiology,
ed. J. A. Ferrendelli. Soc. Neurosci. Symp. 4:83–98.
LeVay, S., T.N. Wiesel, and D.H. Hubel (1980) The development of
ocular dominance columns in normal and visually deprived monkeys. J.
Comp. Neurol. 191:1–51.
Levitt, P., and P. Rakic (1980) Immunoperoxidase localization of
glial fibrillary acid protein in radial glial cells and astrocytes of
the developing rhesus monkey brain. J. Comp. Neurol. 193: 815–840.
Levitt, P., Cooper, M.L., and Rakic, P. (1983) Early divergence and
changing proportion of neuronal and glial precursor cells in the primate
cerebral ventricular zone. Dev. Biol. 96:427–484.
Ling, E.A, J.A. Paterson, A. Privat, S. Mori , and C.P. Leblond
(1973) Investigation of glial cells in semithin sections. I.
Identification of glial cells in the brains of young rats. J. Comp.
Neurol. 149:43–72.
Malpeli, J.G., and F.H. Baker (1975) The representation of the visual
field in the lateral geniculate nucleus of Macaca mulatta. J.
Comp. Neurol. 161:569–594.
Marrocco, R.T., J.W. McClurkin, and R.A. Young (1982) Spatial
summation and conduction latency classification of cells of the lateral
geniculate nucleus of macaques. J. Neurosci. 2:1275–1291.
Matthews, M.A., C.H. Narayanan, Y. Narayanan, and D.J. Siegenthaler-Matthews
(1982) Inhibition of axoplasmic transport in the developing visual
system of the rat. III. Electron microscopy and Golgi studies of retino-fugal
synapses and post-synaptic neurons in the dorsal lateral geniculate
nucleus. Neuroscience 7:405–422.
McLoon, S.C. (1982) Alteration in precision of the crossed
retinotectal projection during chick development. Science 215:1418–1420.
Montero, V.M., and J. Zempel (1986) The proportion and size of
GABA-immunoreactive neurons in the magnocellular and parvocellular
layers of the lateral geniculate nucleus of the rhesus monkey. Exp.
Brain Res. 62:215–223.
Nishimura, Y., and P. Rakic (1985) Development of the rhesus monkey
retina. I. Emergence of the inner plexiform layer and its synapses. J.
Comp. Neurol. 241:420–434.
Nishimura, Y., and P. Rakic (1987) Development of the rhesus monkey
retina: II. A three-dimensional analysis of the sequence of synaptic
combinations in the inner plexiform layer. J. Comp. Neurol. XX:XXX–XXX.
Norden, J.J., and J.H. Kaas (1978) The identification of relay
neurons in the dorsal lateral geniculate nucleus of monkeys using
horseradish peroxidase. J. Comp. Neurol. 182:707–725.
Ogren, M.P., P. Rakic, and P. Goldman-Rakic (1984) Consequences of
prenatal striate cortex lesions on retinogeniculate projections in the
monkey. Invest. Ophthalmol. Vis. Sci. 24:64.
O'Leary, D.D.M., J.W. Fawcett, and W.M. Cowan (1986) Topographic
targeting errors in the retinocollicular projection and their
elimination by selective ganglion cell death. J. Neurosci. 6:3692–3705.
Pasik, P., T. Pasik, J. Hamori, and G.R. Holstein (1986) GABA
immunoreactivity in monkey lateral geniculate nucleus (LGN) at light and
electron microscopic levels. Soc. Neurosci. Abs. 11:317.
Perry, V.H., R. Oehler, and A. Cowey (1984) Retinal ganglion cells
that project to the dorsal lateral geniculate nucleus in the macaque
monkey. Neuroscience 12:1101–1123.
Peters, A., C.C. Proskauer, M.L. Feldman, and L. Kimerer (1979) The
projection of lateral geniculate nucleus to area 17 of the rat cerebral
cortex. V. Degenerating axon terminals synapsing with Golgi-impregnated
neurons. J. Neurocytol. 8:331–357.
Prestige, M.C. (1970) Differentiation, degeneration, and the role of
the periphery: Quantitative considerations. In The Neurosciences, Second
Study Program F.O. Schmitt, ed. pp. 73–82. New York. Rockerfeller Univ.
Press.
Provis, J.M., D. van Driel, F.A. Billson, and P. Russell (1985) Human
fetal optic nerve: Overproduction and elimination of retinal axons
during development. J. Comp. Neurol. 238:92–101.
Rakic, P. (1972) Mode of cell migration to the superficial layers of
fetal monkey neocortex. J. Comp. Neurol. 145:61–84.
Rakic, P. (1974) Neurons in rhesus monkey visual cortex: Systematic
relation between time of origin and eventual disposition. Science:
183:425–427.
Rakic, P. (1976) Prenatal genesis of connections subserving ocular
dominance in the rhesus monkey. Nature 261:467–471.
Rakic, P. (1977a) Genesis of the dorsal lateral geniculate nucleus in
the rhesus monkey: Site and time of origin, kinetics of proliferation,
routes of migration and pattern of distribution of neurons. J. Comp.
Neurol. 176:23–52.
Rakic, P. (1977b) Prenatal development of the visual system in rhesus
monkey. Phil Trans. R. Soc. Lond. B. 278:245–260.
Rakic, P. (1981) Development of visual centers in the primate brain
depends on binocular competition before birth. Science 214:928–931.
Rakic, P. (1986) Mechanisms of ocular dominance segregation in the
lateral geniculate nucleus: Competitive elimination hypothesis. Trends
Neurosci. 5:11–19.
Rakic, P., and K.P. Riley (1983a) Overproduction and elimination of
retinal axons in the fetal rhesus monkey. Science 219:1441–1444.
Rakic, P., and K.P. Riley (1983b) Regulation of axon number in
primate optic nerve by prenatal binocular competition. Nature
305:135–137.
Rakic, P., and R.W. Williams (1986) Thalamic regulation of cortical
parcellation: An experimental perturbation of the striate cortex in
rhesus monkeys. Soc. Neurosci. Abst. 12:1499.
Rowe, M.J. (1982) Development of mammalian somatosensory pathways.
Trends Neurosci. 5:408–411.
Satorre, J., J. Cano, F. Reinoso-Suárez (1986) Quantitative cellular
changes during postnatal development of the rat dorsal lateral
geniculate nucleus. Anat. Embryol. 174:321–327.
Schiller P.H., and J.G. Malpeli (1978) Functional specificity of
lateral geniculate nucleus laminae of the rhesus monkey. J. Neurophysiol.
41:788–797.
Scholtz, C.L., K. Swettenham, A. Brown, and D.M.A. Mann (1981) A
histoquantitative study of the striate cortex and lateral geniculate
body in normal, blind and demented subjects. Neuropath. Appl. Neurobiol.
7:103–114.
Sengelaub, D.R., L.F. Jacobs, and B.L. Finlay (1985) Regional
differences in normally occurring cell death in the developing hamster
lateral geniculate nuclei. Neurosci. Let. 55:103–108.
Shapley, R., E. Kaplan, and R. Soodak (1981) Spatial summation and
contrast sensitivity of X and Y cells in the lateral geniculate nucleus
of the macaque. Nature 292:543–545.
Shatz, C.J., and M.B. Luskin (1986) The relationship between the
geniculocortical afferents and their cortical target cells during
development of the cat's primary visual cortex. J. Neurosci.
6:3655–3668.
Shatz, C.J., and P. Rakic (1981) The genesis of efferent connections
from the visual cortex of the fetal rhesus monkey. J. Comp. Neurol.
196:287–307.
Shatz, C.J., and D. W. Sretavan (1986) Interactions between retinal
ganglion cells during the development of the mammalian visual system.
Ann. Rev. Neurosci. 9: 171–207.
Shotwell, S.L., C.J. Shatz, and M.B. Luskin (1986) Development of
glutamic acid decarboxylase immunoreactivity in the cat's lateral
geniculate nucleus. J. Neurosci. 6:1410–1423.
Sullivan, P.R., J. Kuten, M.S. Atkinson, J.B. Angevine, and P.I.
Yakovlev (1958) Cell count in the lateral geniculate nucleus of man.
Neurol. 58: 566–567
van der Loos, H., and E. Welker (1985) Development and plasticity of
somatosensory brain maps. In: M.J. Rowe and W.D. Willis (eds):
Development, Organization, and Processing in Somatosensory Pathways. New
York: Alan Liss.
Weller, R. E., J.H. Kaas, and A.B. Wetzel (1979) Evidence for the
loss of X-cells of the retina after long-term ablation of visual cortex
in monkeys. Brain Res. 160:134–138.
White, E.L. (1979) Thalamocortical synaptic relations: A review with
emphasis on the projections of specific thalamic nuclei to the primary
sensory areas of the neocortex. Brain Res. Rev. 1:275–311.
Williams, R.W., M.J. Bastiani, and L.M. Chalupa (1983) Loss of axons
in the cat optic nerve following fetal unilateral enucleation: An
electron microscopic analysis. J. Neurosci. 3:1554–1564.
Williams, R.W., M.J. Bastiani, B.Lia, and L.M. Chalupa (1986) Growth
cones, dying axons, and developmental fluctuations in the fiber
population of the cat's optic nerve.
J. Comp. Neurol. 246:32–69.
Williams, R.W., and K. Herrup (1988) Control of neuron number.
Ann. Rev. Neurosci. 11:423–453.
Williams, R.W., and P. Rakic (1985) Number of neurons in the monkey's
dorsal lateral geniculate nucleus during development. Soc. Neurosci.
Abs. 11:804.
Williams, R.W., and P. Rakic (1986) Pronounced architectonic
differences between monocular and binocular segments of the monkeys
striate cortex. Soc. Neurosci. Abst. 12:1498.
Williams, R.W., K. Ryder, and P. Rakic (1987) Emergence of
cytoarchitectonic differences between areas 17 and 18 in the developing
rhesus monkey. Soc. Neurosci. Abst. 13:in press.
Yakovlev, P.I. (1970) Whole brain serial histological sections. In:
Neuropathology: Methods and Diagnosis. C.G. Tedeschi. Little, Brown and
Company, 1970, pp.371–378.
Footnote 1. High variability (up to 10-fold) in the index of necrosis
has been noted previously by Prestige (1970, his figure 2B) in the
spinal cord of Xenopus larvae, even though absolute neuron
numbers in the same animals show very little variation.
Footnote 2. Both humans and rhesus macaques have 1.2 to 1.5 million
retinal ganglion cells and about 1.0 to 1.5 million geniculate neurons (Chacko,
1948; Chow et al., 1950; Sullivan et al., 1958). Developmental changes
in the number of retinal ganglion cell axons are also remarkably similar
in these two primates (cf., Rakic and Riley, 1983; Provis et al., 1986).
Using the gestational age at which retinal axon number peaks in the two
species as a time standard (E90 in rhesus and E110 in human), we
estimate that the putative period of neuron loss in the human lateral
geniculate should extend from E60 to E120. Gestation is 165 days in
rhesus monkeys and 265 days in humans.
Footnote 3. A template of geniculocortical topography could
conceivably be established between geniculate axons and cells in the
subplate before the geniculate axons grow into the cortex. If this is
the case then the subplate may play a role in organizing or filtering
axons destined for visual cortex. |

Since 11 August 98, Updated 21 January 2001
|
|
|

 Publications