 |
| |||||
|
| ||||||||
|
| ||||||||
Home  Publications Publications |
|
|
Note to the Reader This is a preprint of a paper to be published in The Journal of Neuroscience.
Print Friendly
Abstract Cell Production Synopsis
AbstractRetinal ganglion cell numbers in adult mice vary from 40,000 to 80,000.
Much of this variation, and the prominent bimodality of strain averages,
is generated by allelic variants at the Nnc1 locus on chromosome
11. The Nnc1 locus may modulate either ganglion cell production or
the severity of ganglion cell death. Here we have determined what the
relative contributions of these two processes are to variation in adult
cell number by estimating total ganglion cell production in 10 strains of
mice (A/J, BALB/cJ, BXD32, C57BL/6J, CAST/Ei, CARL/ChGo, CE/J, C3H/HeSnJ,
DBA/2J, and LP/J). These strains have adult populations that range from
45,000 to 76,000 (data available at
../main/databases.html). We estimated cell production by counting
ganglion cell axons after ganglion cell neurogenesis, but before the onset
of significant cell death.
IntroductionNumbers of retinal ganglion cells range from fifty thousand in
nocturnal rodents to several million in diurnal birds and primates (Rager
and Rager, 1978; Rakic and Riley, 1983; Finlay and Pallas, 1989; Williams
et al., 1996). Variation is also marked within species: numbers range from
0.7 to 1.5 million in humans (Curcio and Allen, 1990), and from 40,000 to
80,000 in mice. In mice, the distribution of strain averages is bimodal,
with distinct modes centered at 55,000 and 64,000. We have demonstrated
that this variation is primarily genetic, with a heritability of ~0.8
(Williams et al., 1996). We subsequently discovered that most of the
bimodality in strain averages is controlled by a major quantitative trait
locus, neuron number control 1 (Nnc1). This quantitative trait
locus (QTL) is located on chromosome (Chr) 11 and is closely linked to
three genes known to influence retinal development—the retinoic acid
receptor alpha, neuregulin, and the thyroid hormone receptor alpha
(Williams et al., 1998a). Nnc1 may influence ganglion cell number
by modulating either cell production or the severity of natural cell
death.
Materials and MethodsAnimals. As illustrated in figure 1, strains of mice were chosen primarily to represent the two major modes in ganglion cell number (Williams et al., 1996). Three standard inbred strains were selected from the low mode (C57BL/6J, A/J, and LP/J) and four standard inbred strains were selected from the high mode (BALB/cJ, C3H/HeSnJ, CE/J, and DBA/2J). All of these strains were obtained from the Jackson Laboratory, (Bar Harbor, ME). In addition, we selected two strains—CAST/Ei and BXD32—that have exceptionally low and high ganglion cell numbers, respectively. BXD32 was obtained from Dr. Benjamin Taylor at the Jackson Laboratory. CAST/Ei is an inbred strain derived from M. musculus castaneus that we obtained from Dr. Eva Eicher at the Jackson Laboratory. Finally, we studied an outbred sample of Mus caroli that we refer to as CARL/ChGo, a strain that falls into the low ganglion cell mode. CARL/ChGo is a partially inbred strain of M. caroli given to us by Dr. Dan Goldowitz at the University of Tennessee. Both CARL/ChGo and CAST/Ei are representatives of wild species endemic to Southeast Asia. All mice were mated in our colony to produce neonates. The day of birth was designated postnatal day zero (P0).
Figure 1. Bimodal distribution of adult ganglion cell averages for 60 inbred strains. The strains include 38 recombinant inbred strains and 17 standard inbred strains listed by Williams et al. (1996), and 5 additional strains, 3 of which are included in this study. A Gaussian probability distribution was computed for each strain and summed to obtain a probability density plot (see Williams et al., 1998, for methods). The figure shows that most strains fall into two main modes. The Gaussian function drawn in the background has a mean of 60.6 ± 6.3 (x1000), the average and SD of the 60 strains. The arrows designate the strain averages for the ten strains examined in this study.
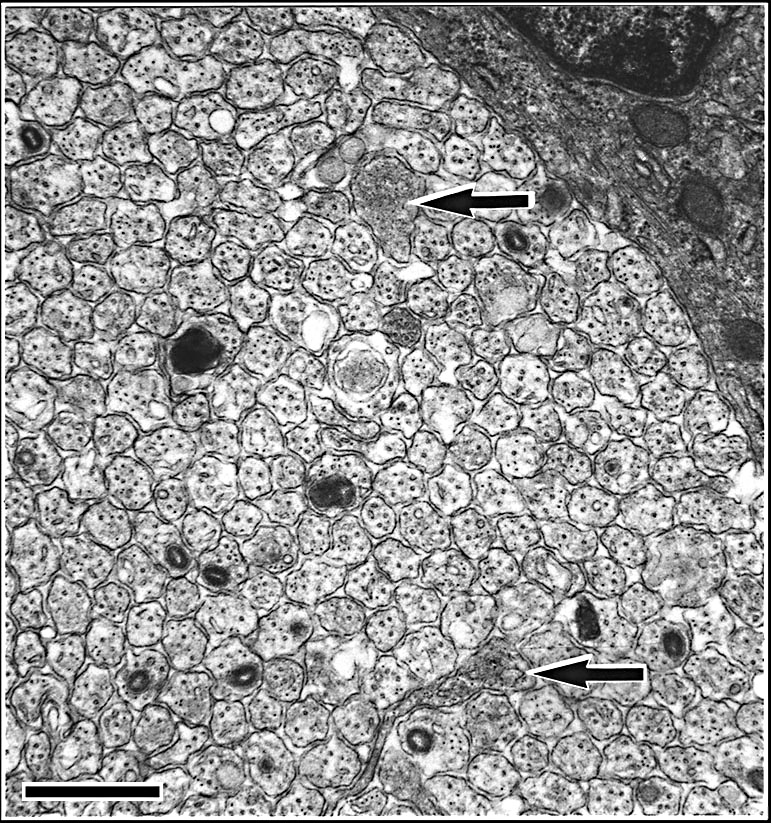
Tissue preparation. We anesthetized neonates by placing them on ice for several minutes. Neonates were then perfused transcardially with 0.1 M phosphate buffered saline (0.9%), followed by fixative (2.5% glutaraldehyde and 2.0% paraformaldehyde in 0.1 M phosphate buffer). Midorbital segments of optic nerves were dissected from the neonates, osmicated, and embedded in Spurr’s resin. Nerves were thin-sectioned, placed on formvar-coated grids, and stained with lead citrate and uranyl acetate. Estimating ganglion cell number. We estimated ganglion cell numbers by counting axons in optic nerve cross-sections (Williams et al., 1996). Previous studies have demonstrated that axon counts are reliable estimates of ganglion cell number: bifurcating axons, retinopetal and retinoretinal axons, and axon loss resulting from a ganglion cell transforming into an amacrine cell, are comparatively rare in mammals even during development (Perry et al., 1983; Chalupa et al., 1984; Lia et al., 1986; Williams et al., 1986; Rice et al., 1995, see table 2). Nerves were photographed in a grid pattern at ~x30,000 using a JEOL EX2000II electron microscope. High and low magnifications were calibrated for each case by photographing a grid replica (2160 lines/mm, EMS, Fort Washington, PA). Unmyelinated axons were easily identified (Fig. 2). Axons were counted directly on negatives within a 63 x 86 mm counting frame. Total axon estimates were calculated by multiplying the mean axon density by the total area of the optic nerve.
We counted necrotic axons in neonatal optic nerves from two strains belonging to the high mode and two strains belonging to the low mode. We did this by systematically scanning the entire optic nerve cross-section for necrotic axons at x15,000. The criteria for distinguishing necrotic axons are those described in Williams et al., (1986). We also searched for growth cones in the sample of photographs used for counting axons and by scanning several optic nerves at high magnification (>x40,000).
ResultsThe retinal ganglion cell population at birth ranged from 131,000 to 224,000 (Table 1). The mean for all 46 cases is 182,500 ± 4,400 SE. This value is almost three times higher than the average for an equally diverse sample of adult mice (Williams et al., 1996). On average we counted five neonates per strain. The coefficient of variation within strains averaged 8.2%—only slightly higher than the 7.2% value obtained for adult mice. The small increase is probably due to the technical difficulty of counting axons before they are myelinated. Given the anticipated variation in the stage of maturation of sets of neonatal mice sacrificed at birth, this CV is low and suggests that the ganglion cell population within a strain is comparatively stable at this stage of development. The average coefficient of error (the standard error divided by the sample mean) averaged 4.5% in neonates and 2.5% in adults. These values provide an assessment of the reliability of adult and neonatal ganglion cell counts.
Cell ProductionIf strain differences in adult ganglion cell numbers result from differences in the number of neurons that are generated, then at birth each strain should have a population that is approximately three–fold higher than its adult mean. The slope of the regression should be close to 1:3 and the correlation should be high. This is what we found. The slope of a free regression for the ten strains is 0.26 ± 0.07 (Fig. 3). Forcing the regression line through the origin produces the expected slope of 1:3 with an excellent fit (inset to Fig. 3). The positive y–intercept (11,600 adult cells) in the free regression may result from sampling error, non–linearity of cell death, or may indicate a basal level of cell production. The correlation coefficient of the free regression in Fig. 3 is 0.81, and the corresponding coefficient of determination (r2) is 0.66. Thus, two–thirds of the variance in adult cell number can be readily explained by strain differences in cell genesis.
Figure 3. Regression of neonatal (P0) and adult ganglion cell number averages for ten strains. Error bars represent one standard error of the mean. The thin regression line includes all strains and the coefficient of determination for these data is 0.66. The thick regression line excludes strains CAST/Ei and BXD32 and the coefficient of determination is 0.77. The inset (bottom right) plots the same data but with the regression line forced through the origin. [If there is no cell production, the adult cell number must be zero.]
We were particularly interested in understanding the process that produces the bimodality of adult strain averages and for this reason we also restricted the analysis to the eight strains belonging to high and low modes (Fig. 3, bold line). The coefficient of determination for this subset of points is 0.77, indicating that the bimodality is generated primarily by differences in ganglion cell production. The remaining “unexplained” variance must result from strain differences in the severity of cell death, developmental noise, and technical error.
Figure 4. Regression of numbers of cells that are lost (number at P0 minus the number at maturity) and adult ganglion cell number from our data (4A), and two alternative Monte Carlo simulations (4B and 4C). The first model (4B) assumes that all differences in ganglion cell number are caused by cell production differences, whereas the second model (4C) assumes that all differences are caused by variation in the severity of cell death. Monte Carlo datasets consisted of 200 numbers randomly selected from normal distributions. In both models, high and low adult ganglion cell groups, (n = 100 each), were selected from two normal distributions with seed parameters (mean and standard deviation) from the 5 high (66,800 ± 5,400) and 5 low (50,920 ± 3,800) strains that we studied. In the production model (4B), means were obtained from two normal distributions with seed parameters (mean and standard deviation) from the 5 high (202,680 ± 15,500) and 5 low (158,100 ± 21,200) strains. In the case of the cell death model (4C), where no production differences are assumed, the neonatal means were obtained from a single distribution, with a mean and standard deviation of all 10 strains combined (180,390 ± 18,400). The slope obtained with our real data is +1.5 (4A), while the cell production (4B) and cell death (4C) models are +1.2 and -1.1, respectively. The positive slope from our data is close to that of the simulated cell production model, demonstrating that differences in adult ganglion cell number are predominantly due to differences in cell production. In this analyses we used Model I linear least-square regression because the measurement error term is without bias. Adult ganglion cell number was subtracted from P0 ganglion cell number to make the y-axis formally independent of adult ganglion cell number plotted on the x-axis.
Our statistical analysis is complicated by two factors: first the
parameters plotted in Fig. 3 are not formally independent—total cell
production cannot be less than the adult population. Second, the
distribution of adult values is far from normal (Fig. 1). Conventional
statistical estimates are therefore difficult to interpret. To address
these problems we carried out Monte Carlo simulations to test cell
production and cell death models using seed parameters taken from the
adult distribution. We also subtracted the adult population from the
neonatal population to insure independence between the parameters (Fig.
4A). Figures 4B and 4C show the outcomes of two typical Monte Carlo
simulations in which we plot adult cell number against the number of lost
cells. The first model (Fig. 4B) assumes that all differences in adult
cell number are caused by matched differences in cell production and that
cell death is strictly proportional to cell production. The second model
(Fig. 4C) assumes that all differences among adult strains are caused by
variation in the severity of cell death and that at birth all strains have
roughly the same cell population (~180,400 ± 18,400 cells). In the cell
production simulation (4B) the regression slope is +1.2, whereas in the
cell death simulation (4C) the slope is -1.1. Our actual dataset (Fig. 4A)
with its slope of +1.5 strongly supports a cell production model.
Cell DeathWith the exception of strains BXD32, CARL/ChGo, and BALB/cJ, the
average percentage of cell death among strains is relatively uniform—69% ±
1.2% (Table 1). While the percentage of cell death is relatively uniform,
the absolute magnitude of ganglion cell death is variable among strains
and is highly correlated with production values (Table 1).
Necrotic Axons and Growth ConesThe validity of our quantitative analysis depends on the assurance with which we can estimate total ganglion cell production in mice. If much cell loss occurs before birth or much cell addition occurs after birth, then production estimates based on axon counts in the optic nerve at P0 will be too low. To rule out the possibility that significant cell death occurs prenatally, we counted necrotic axons in neonatal optic nerves from strains belonging to the high and low modes using criteria described by Williams and colleagues (1986). Necrotic axons are relatively easy to see, and it was practical to count all sites of necrosis in a single optic nerve cross-section. Necrotic axons at P0 make up 0.02% and 0.05% of the fiber population in cases selected from the low strains, A/J and C57BL/6J, respectively, whereas they make up 0.07% and 0.09% of the population in cases selected from the high strains, BXD32 and C3H/HeSnJ, respectively. The fact that a somewhat higher incidence of necrosis was noted in nerves taken from the high strains makes it very unlikely that variation in early axon loss accounts for differences between adult values. Growth cones were exceedingly rare in all material and fewer than 5 profiles among all cases met even a relatively lax criteria for these structures (Williams et al., 1986; Williams et al., 1991; Colello and Guillery, 1992).
Specificity of Strain DifferencesDo strain differences in retinal ganglion cell number correspond to differences in total brain weight or are differences among strains specific to the ganglion cell population? The correlation of ganglion cell number and brain weight across individual mice is 0.37, but when strain averages are used the correlation rises to 0.75. This suggests that about half the variance in neonatal ganglion cell number can be explained directly or indirectly by differences in brain weight. As assessed by quantitative DNA analysis, brain weight differences among neonatal mice are primarily due to differences in total cell number (Zamenhof and Marthens, 1976). Thus, mechanisms modulating ganglion cell number may have common effects on cell number in the other parts of the CNS. The correlation between strain averages of adult brain weight and ganglion cell number for the same strains is only 0.51. Given the wide confidence intervals of correlations computed with low numbers of cases, the difference between the adult and neonatal correlations (0.51 and 0.75, respectively) may be due to sampling error. But it is also conceivable that strain variation in cell death decreases an initially high correlation between brain weight and retinal ganglion cell number. In any case, the cellular specificity of the strain differences is likely to be low, and we expect differences in numerous other neuronal cell populations to be closely matched with the differences we find in ganglion cell number.
Discussion
Synopsis. Our analysis demonstrates that most of the variation in adult ganglion cell number among strains of mice can be traced to differences in cell production. Allelic variants at the Nnc1 locus on Chr 11 (Williams et al., 1996; Williams et al., 1998a) generate the pronounced bimodality in ganglion cell population size by modulating ganglion cell production.
Generation and Death of Retinal Ganglion CellsGeneration of retinal ganglion cells in mice begins on embryonic day 11
(E11) and lasts until just before birth (Dräger, 1985). There is a short
delay between neurogenesis and the time at which ganglion cell axons
extend into the optic nerve (Colello et al., 1992). This delay could
deflate estimates of total cell production. However, very few ganglion
cells are produced after E18 (Dräger, 1985) and as anticipated from the
work of Colello and Guillery (1992), we did not observe growth cones in
neonatal optic nerves. It is therefore unlikely that our estimates of
total production are biased downward by late ganglion cell generation.
Mechanism GeneratingDifferences in Ganglion Cell ProductionWe recently mapped a gene, Nnc1, that is responsible for more
than half of the genetic variance in ganglion cell number in mice, and
generates the pronounced bimodality that we discovered among strain
averages (Williams et al., 1998a). Nnc1 is the first locus known to
control normal variation in cell number in the vertebrate CNS. The thyroid
hormone receptor alpha gene (Thra) is a superb candidate gene.
Thra maps within 1–2 cM of Nnc1 on chromosome 11 (Montgomery et
al., 1997), and is expressed within the developing chick retina (Sjöberg
et al., 1992). The ligand of THRA, triiodothyronine, is known to influence
retinal ganglion cell fate determination (Hoskins, 1985), retinal
maturation rate (Macaione et al., 1984), and hypothyroidism during retinal
development results in decreased cell density in the ganglion cell layer
(Hoskins, 1985; Navagantes et al., 1996).
Variation in Retinal Ganglion Cell DeathThe severity of cell death is close to 68–70% in most strains of mice.
However, there are three exceptional strains with less severe loss. Three
to nine percent fewer cells are lost in BXD32, CARL/ChGo, and BALB/cJ.
BXD32 is particularly interesting because it has the highest adult
population (75,800 ± 1,900) among the 60 strains we have now examined. Yet
at birth BXD32 has an unexceptional number—199,500—that is lower than
three other strains. Clearly, one or more genes controlling rates of
ganglion cell death are responsible for the high adult cell number in this
strain. It would be feasible to map a cell death gene by crossing BXD32 to
a strain with similar ganglion cell production but higher cell death.
Nnc1 Controls Cell ProductionÅWe have shown that as much as 77% of the variation among adult strains
results from differences in the production of ganglion cells. The
percentage of cell death in high and low groups does not differ
significantly (66.9% and 67.5%, respectively). We conclude that variation
in adult ganglion cell number among inbred mouse strains results
predominantly from differences in cell production. Comparison of our data
with the Monte Carlo simulations (Fig. 4) corroborates this conclusion.
AcknowledgmentsWe thank K. Troughton for technical help and D. Goldowitz for providing us with M. caroli pups. This research was supported by grants from the National Institutes of Health to R.W. (NINDS R01 NS35485 and the NEI EY08868). R.C.S. was supported in part by U.S. Public Health Service Training Grant RNS-07323.
ReferencesAlexiades M, Cepko C (1996) Quantitative analysis of proliferation and cell cycle length during development of the rat retina. Dev Dynamics 205: 293–307. Alexiades MR, Cepko CL (1997) Subsets of retinal progenitors display temporally regulated and distinct biases in the fates of their progeny. Development 124: 1119–1131. Anchan RM, Reh TA, Angello J, Balliet A, Walker M (1991) EGF and TGF-a stimulate retinal neuroepithelial cell proliferation in vitro. Neuron 6: 923–936. Bermingham-McDonogh O, McCabe KL, Reh TA (1996) Effects of GGF/neuregulins on neuronal survival and neurite outgrowth correlate with erbB2/neu expression in developing rat retina. Development 122: 1427–1438. Binoux M, Faivre-Bauman A, Lassarre C, Barret A, Tixier-Vidal A (1985) Triiodothyronine stimulates the production of insulin-like growth factor (IGF) by fetal hypothalamus cells cultured in serum-free medium. Dev Brain Res 21: 319–321. Cepko CL, Austin CP, Yang X, Alexiades M, Ezzeddine D (1996) Cell fate determination in the vertebrate retina. Proc Natl Acad Sci USA 93: 589–595. Chalupa L, Williams R, Henderson Z (1984) Binocular interaction in the fetal cat regulates the size of the ganglion cell population. Neuroscience 12: 1139–1146. Colello RJ, Guillery RW (1992) Observations on the early development of the optic nerve and tract of the mouse. J Comp Neurol 317: 357–378. Curcio CA, Allen KA (1990) Topography of ganglion cells in human retina. J Comp Neurol 300: 5–25. Dorsky RI, Chang WS, Rapaport DH, Harris WA (1997) Regulation of neuronal diversity in the Xenopus retina by Delta signalling. Nature 385: 67–70. Dräger U (1985) Birth dates of retinal ganglion cells giving rise to the crossed and uncrossed optic projections in the mouse. Proc R Soc Lond 224: 57–77. Finlay BL, Pallas SL (1989) Control of cell number in the developing mammalian visual system. Prog Neurobiol 32: 207–234. Frade JM, Martí E, Bovolenta P, Rodríguez-Peña MA, Pérez-García D, Rohrer H, Edgar D, Rodríguez-Tébar A (1996) Insulin-like growth factor-I stimulates neurogenesis in chick retina by regulating expression of the a6 integrin subunit. Development 122: 2497–2506. Guillemot F, Joyner AL (1993) Dynamic expression of the murine Achaete-Scute homologue Mash-1 in the developing nervous system. Mech Dev 42: 171–185. Hernández-Sánchez C, López-Carranza A, Alarcón C, Rosa EJ, Pablo F (1995) Autocrine/paracrine role of insulin-related growth factors in neurogenesis: local expression and effects on cell proliferation and differentiation in retina. Proc Natl Acad Sci USA 92: 9834–9838. Hoskins SG (1985) Control of the development of the ipsilateral retinothalamic projection in Xenopus laevis by thyroxine: results and speculation. J Neurobiol 17(3): 203–229. Ilia M, Jeffery G (1996) Delayed neurogenesis in the albino retina: evidence of a role for melanin in regulating the pace of cell generation. Dev Brain Res 95: 176–183. Ilia M, Jeffery G (1998) Retinal mitosis is regulated by dopa, a melanin precursor that may influence the time at which cells exit the cell cycle: analysis of patterns of cell production in pigmented and albino retinae. J Comp Neurol (in press). Jacobson M (1991) Developmental Neurobiology. New York: Plenum Press. Lia B, Williams RW, Chalupa LM (1986) Does axonal branching contribute to the overproduction of optic nerve fibers during early development of the cat's visual system? Brain Res 390: 296–301. Lillien L, Cepko C (1992) Control of proliferation in the retina: temporal changes in responsiveness to FGF and TGFa. Development 115: 253–266. Linden R, Pinto LH (1985) Developmental genetics of the retina: evidence that the pearl mutation in the mouse affects the time course of natural cell death in the ganglion cell layer. Exp Brain Res 60: 79–86. Ma Y-T, Hsieh T, Forbes ME, Johnson JE, Frost DO (1998) BDNF injected into the superior colliculus reduces developmental retinal ganglion cell death. J Neurosci 18: 2097–2107. Macaione S, Di-Giorgio R, Nicotina P, Lentile R (1984) Retina maturation following adminstration of thyroxine in developing rats: effects on polyamine metabolism and glutamate decarboxylase. J Neurochem 43: 303–315. Montgomery JC, Silverman KA, Buchberg AM (1997) Chromosome 11. Mamm Genome 7: 190–208. (http://www.informatics.jax.org) Navagantes LC, Silveira LC, Santos GL (1996) Effect of congenital hypothyroidism on cell density in the ganglion cell layer of the rat retina. Braz J Med Biol Res 29: 665–668. Perry VH, Henderson Z, Linden R (1983) Postnatal changes in retinal ganglion cell and optic axon populations in the pigmented rat. J Comp Neurol 219: 356–368. Rager G, Rager U (1978) Systems-matching by degeneration. Exp Brain Res 33: 65–78. Rakic P, Riley K (1983) Overproduction and elimination of retinal axons in the fetal rhesus monkey. Science 219: 1441–1444. Rice DS, Williams RW, Goldowitz D (1995) Genetic control of retinal projections in inbred strains of albino mice. J Comp Neurol 354: 459–469. Rosa EJ, Arribas A, Frade JM, Rodríguez-Tébar A (1993) Role of neurotrophins in the control of neural development: neurotrophin-3 promotes both neuron differentiation and survival of cultured chick retinal cells. Neuroscience 58: 347–352. Sjöberg M, Vennström B, Forrest D (1992) Thyroid hormone receptors in chick retinal development: differential expression of mRNAs for a and N-terminal variant b receptors. Development 114: 39–47. Watanabe T, Raff MC (1990) Rod photoreceptor development in vitro: intrinsic properties of proliferating neuroepithelial cells change as development proceeds in the rat retina. Neuron 2: 461–467. Williams MA, Piñon LGP, Linden R, Pinto LH (1990) The pearl mutation accelerates the schedule of natural cell death in the early postnatal retina. Exp Brain Res 82: 393–400. Williams RW, Bastiani MJ, Lia B, Chalupa LM (1986) Growth cones, dying axons and developmental fluctuations in the fiber population of the cat's optic nerve. J Comp Neurol 246: 32–69. Williams R, Borodkin M, Rakic P (1991) Growth cone distribution patterns in the optic nerve of fetal monkeys: Implications for mechanisms of axonal guidance. J Neurosci 11: 1081–1094. Williams RW, Goldowitz D (1992) Lineage versus environment in embryonic retina: a revisionist perspective. Trends Neurosci 15: 368–373. Williams RW, Strom RC, Rice DS, Goldowitz D (1996) Genetic and environmental control of variation in retinal ganglion cell number in mice. J Neurosci 16: 7193–7205. Williams RW, Strom RC, Goldowitz D (1998a) Natural variation in neuron number in mice is linked to a major quantitative trait locus on Chr 11. J Neurosci 18: 138–146. Williams RW, Strom RS, Zhou G, Yan Z (1998b) Genetic dissection of retinal development. In: Seminars in Cell & Developmental Biology 9:249–255. Zamenhof S, Marthens E (1976) Neonatal and adult brain parameters in mice selected for adult brain weight. Dev Psychobiol 9: 587–593.
ContentsAbstract Cell Production Synopsis
Since 18 August 98
|
|||||||||||||||||||||||||||||||||||||||||||||||||||||||||||||||||||||||||||||||||||||||||||||||||||||||||||||||||||||
Neurogenetics at University of Tennessee Health Science Center
| Print Friendly | Top of Page |
Mouse Brain Library | Related Sites | Complextrait.org
