 |
| |||||
|
| ||||||||
|
| ||||||||
Home  Publications Publications |
|
|
Note to the Reader This is a revised edition of a paper published in The Journal of Neuroscience in 1993. Several figures have been added. Text additions are in brackets [...]. Enlarging images. Thumbnail versions of all figures are embedded in the paper. Full-size images—usually under 300K—will download into a new window when you select the thumbnails. Drag the new window to the side of the text window. In some cases, high-resolution images—usually under 600K—that match the quality of the original micrographs can be downloaded by selecting the last line of the legend. These large images can be viewed with Adobe Photoshop, NIH Image, or equivalent.
Print Friendly The Journal of Neuroscience 13: 208–228 (1993)
Abstract Comparison of body and brain weights Evolutionary history of the domestic cat
[Key words: brain size, allometry, rods and cones, retinal ganglion cells, optic nerve, lateral geniculate nucleus, cell death] Introduction
The tempo of mammalian brain evolution has been rapid. Twofold changes in
brain weight have occurred over periods of 1–5 million years in several
lineages, including that of humans (Edinger, 1948, 1966; Jerison, 1973,
1979; Radinsky, 1973, 1975, 1981; Eisenberg, 1981). Although this is an
interesting and important topic, it has been difficult to study the
process of brain evolution in any detail. Our approach has been to
identify a pair of closely related living species, one from a highly
conservative branch that has retained near identity with the ancestral
species, and the other from a derived branch that has undergone rapid
evolutionary change. The recent recognition that evolution and speciation
can occur in short bursts separated by long interludes of stasis provides
a sound theoretical basis for a search for such pairs (Schindewolf, 1950;
Eldredge and Gould, 1972; Stanley, 1979; Gould and Eldredge, 1986). Materials and MethodsTwo adult wildcats (Felis silvestris tartessia Miller, 1907), a
male (S1) and a female (S2), were received from the Institute for the
Conservation of Nature (ICONA), Spain. Both animals had been rescued from
game traps in the Sierra Morena of south central Spain. The two animals
had been held for several months in a large outdoor pen. Breeding was
thought to have failed. Both animals were thin but in good health. They
both had the coat color and pattern typical of wildcats and many domestic
tabby cats (Haltenorth, 1953; Rodríguez de la Fuente, 1979). Each had four
prominent dark streaks running down the neck, a single broad dark band
running along the dorsal midline to the base of the tail, six to eight
less distinct dark arched bands running from back to abdomen, and three to
four dark rings around limbs and tails. Figure 26 in Haltenorth (1953)
shows a F. silvestris tartessia type specimen at the Zoologische
Staatssammlung (München, Germany) with a coat pattern almost
indistinguishable from that of our animals. The ages of the two wildcats
were unknown, but both appeared to be young adults. A single fetus was
found in the female after her perfusion.
Confirmation of the wildcat subspecies and the morphological similarity between Spanish wildcats and Pleistocene wildcats. The size and morphology of the teeth and jaws are among the most reliable criteria by which to identify species and subspecies of vertebrate (Kurtén 1954; Carroll, 1988). Without resorting to statistical analysis, the dental measurements taken from our specimens conform closely to those of three F. silvestris tartessia specimens previously studied by Kurtén (1965a). What is even more remarkable and significant is that our wildcats also do not differ appreciably from a sample of Pleistocene wildcats dated approximately 15,000 years before present (late Main Würm). A relatively objective index of the degree of similarity or dissimilarity is provided by the t value calculated for all 13 parameters (values to the right of Table 1). This more rigorous comparison demonstrates that our Spanish wildcats are remarkably similar to Late Main Würm wildcats (t = 0.64), but differ greatly from modern European wildcats (t = 7.11), from domestic cats, including a huge 9 kg domestic tabby cat (t = 4.76), and from a sizable sample of Neolithic (7,500 BP) wildcats (t = 2.41). The overall body size of our wildcats also overlaps measurements on F. silvestris tartessia provided by Haltenorth (1953, his Tables 2 and 4). In sum, the animals we have studied have been correctly classified as F. silvestris tartessia. They are certainly not feral domestic cats, wild hybrids, or a different subspecies of Felis silvestris. The statistical comparisons of data in these tables also document the striking similarity between the Spanish wildcats we studied and wildcats at the close of the Pleistocene, approximately 15,000 years BP. For example, a comparison of the 13 parameters listed in Table 1A gives a Student’s t value of merely 0.64—an insignificant difference. In contrast, the Spanish wildcat differs significantly from other modern European wildcats (t = 7.11). data also provide a strong case that Felis silvestris tartessia represents an isolated relict of a late Pleistocene wildcat population. Sources of domestic cat material. Domestic cat tissue was obtained from our colonies in Madrid and the University of Tennessee and from Drs. L. M. Chalupa, A. Elberger, and D. Frost. An extremely large domestic cat was provided to us by Dr. A. Tuberville to explore the upper limits in the size of the brain and dentary that might be expected among domestic cats. This huge young domestic cat weighed 9 kg, was 61 cm from crown to rump, and had femurs that were 16.5 cm long. Femurs of European wildcats are typically less than 13 cm long (Rohrs, 1955). HRP injection procedure. Injections of horseradish peroxidase (HRP) were made into the left dorsal lateral geniculate nucleus (LGN), left superior colliculus, and left pretectal region of the male wildcat (S1). Similar unilateral (n = 1) and bilateral (n = 3) series of injections were made into normal domestic cats. Some of the domestic cat retinas have been described and illustrated in previous studies (Chalupa et al., 1984; Kirby and Chalupa, 1986). Animals initially received a single intramuscular dose of ketamine (0.4 cc) and atropine (0.2 cc) and were subsequently anesthetized with an intravenous injection of sodium pentobarbital (30 mg/kg). They were placed in a stereotaxic device and craniotomies were made over the approximate locations of the left superior colliculus, pretectum, and dorsal lateral geniculate nucleus. The boundaries of retinorecipient nuclei were mapped by recording multicellular visually evoked activity with a tungsten microelectrode. A series of 150–200 nl injections of 25% HRP diluted in pure dimethylsulfoxide were made along each penetration within the LGN (25 penetrations), pretectum (6 penetrations), and superior colliculus (10 penetrations) as described in Chalupa et al. (1984). The total volume of HRP delivered in a single penetration ranged from 200 to 600 nl. Perfusion and dissection of the animals. All animals received an
overdose of pentobarbital (200 mg) and were subsequently perfused through
the heart with phosphate buffered saline (0.1 M, pH 7.3), followed by a
mixture of 1.25% paraformaldehyde and 2.5% glutaraldehyde in phosphate
buffer. The cranial vault was removed in one large intact piece, and the
brain—including olfactory bulb, pituitary, and the entire medulla (Fig.
1)—the eyes, and segments of most cranial nerves were removed. Retinas
were taken from the eyes and flattened by making a set of radial cuts. The
areas of flatmounted retinas were measured before dehydration. Crania and
dentaries were cleaned in a 25% solution of bleach. Pelts of both wildcats
were returned to ICONA. Processing of retinas. A modification of the Hanker-Yates procedure (Perry and Linden, 1982; Chalupa et al., 1984) was used to demonstrate the presence of HRP within retinal ganglion cells in wildcat S1 and normal domestic cat retinas. The retinas of the female wildcat S2 were stained with toluidine blue using the method described by Wong and Hughes (1987a). Additional domestic cat retinas were mounted between coverslips in glycerin and used for the analysis of the photoreceptor mosaic using methods summarized in Williams (1991). Brain histology. Brains were hemisected in the sagittal plane. The left hemispheres were cut frozen at 50 µm in the coronal plane. These frozen sections were collected and distributed in several series. The first and third series were stained with cresyl violet; the second series was in some cases reacted for HRP histochemistry (S1, D1)using diaminobenzidine as the chromogen. Right hemispheres were embedded in celloidin and cut in either the coronal or the horizontal (S2) plane at 50 µm. For comparison, frozen and celloidin coronal sections from 11 domestic cats cut frozen (n = 7) or embedded in celloidin (n = 4) in the coronal plane were were examined. Photoreceptor analysis. The density of rods and cones was measured along the horizontal meridian in the left retina of S1 and two domestic cats. A x63/1.25 N.A. semiapochromatic objective with a very long working distance (500 µm) was used to focus on the photoreceptor mosaic from either the vitreal or scleral side of the retina using differential interference contrast (DIC) optics, a video overlay system, and semiautomatic image analysis software written for use with an Apple Macintosh computer (Fig. 2). A 50-watt high-pressure mercury light source was used with or without narrow-band interference filters to obtain optimal contrast and resolution. Analog and digital video enhancement were used to improve the contrast of the photoreceptor mosaic as viewed on an RGB monitor. Rods and cones were counted in fields of 144 µm2 and 1000 µm2, respectively, using a video overlay setup (Wikler et al., 1990; Williams, 1991). Locations of sites in the retina were measured with reference to the center of the area centralis using linear encoders attached to the stage (Heidenhain Inc., LS 403 encoders, 0.2 µm resolution, accuracy ± 10 µm over 50 mm). Retinal ganglion cell analysis. The analysis of the distribution
and types of retinal ganglion cells was also carried out using DIC optics.
The depth of ganglion cell dendrites was measured with reference to the
inner border of the inner nuclear layer or the equator of ganglion cell
bodies using a linear encoder (Heidenhain M25, 0.1 µm resolution, accuracy
0.3 µm over 25 mm). The tip of this encoder rested on the stage.
High-magnification plots of ganglion cells (e.g., Fig. 7) were made by
overlaying the video image of the retina onto a graphics program with
variable magnification as shown in Figure 11F. The coordinates of ganglion
cells on these plots are accurate to within 10 µm. Low-power plots were
made using a drawing attachment and a x4 planapochromatic objective. Numbers of axons in the optic nerve. Cross-sections of the
mid-orbital part of the optic nerve were prepared for analysis as
described in previous work (Williams and Chalupa, 1983; Williams et al.,
1986). Counts of axons were obtained in a systematically distributed
sample of fields (typically 50 to 100), and our estimate of average axon
packing density was multiplied by the cross-sectional area of the nerve to
obtain an estimate of the total axon population. A change in sampling
protocol was required because of the large area of the wildcat optic
nerves. The ultrathin sections of the wildcats were too large to fit onto
single grids. Consequently, several grids had to be photographed to sample
the entire cross-section of the nerve. Electron micrographs covered fields
of 467 µm2. The sample area was determined with
the aid of a mesh calibration grid photographed at the end of the sampling
session. Axons in cats are unbranched and therefore the number of optic
axons provides a good estimate of the retinal ganglion cell population (Chalupa
et al., 1984; Lia et al., 1986). LGN cell analysis. The total population of neurons in the
LGN was estimated in both frozen and celloidin embedded material by means
of direct three-dimensional counting using oil immersion objectives and
DIC optics (Williams and Rakic,
1988b). The
main advantage of three-dimensional counting is that no correction
factors—particularly, the often inaccurate Abercrombie correction—are
required to estimate local cell density. Furthermore, this method is
insensitive to variation in processing methods and section thickness.
Neurons in the LGN were distinguished from glial cells and endothelial
cells on the basis of size and nuclear staining as described in detail in
Williams and Rakic (1988a).
Neuronal nuclei, both of principal neurons and interneurons, were counted
in translaminar probes extending through layers A, A1, C, C1, C2, and C3
(and the medial interlaminar nucleus in the most medial probes). Between 9
and 11 probes were made through each nucleus in regions representing
upper, lower, central, and peripheral visual fields. Each probe was made
up of a series of adjacent counting boxes. The depth of the counting
box—the z-axis of the section—was optimized for the thickness of the
individual section. The tops and bottoms of counting boxes were defined
using the linear optical encoder. The average density of neurons in the
counting boxes was calculated and multiplied by the volume of the nucleus
to obtain the total LGN neuron population. ResultsWe have studied two adult wildcats and one fetal wildcat. These animals were extremely difficult to obtain and there was no immediate prospect for increasing numbers of cases. Therefore, our approach has been to analyze the material in detail, as if we had uncovered a small number of rare and important fossils. In some cases, our analysis of the wildcats has extended beyond data initially available for the domestic cat. This is true for the analyses of photoreceptor distribution and dendritic differences among on-center and off-center beta cells. Despite the small sample size, the central result of this study—the marked differences in populations of retinal ganglion cells and of geniculate neurons—do achieve statistical significance. With respect to other facets of this study, particularly those based on single animals, we have tried to be circumspect in our conclusions and to point out interpretative caveats. In several instances we provide more complete documentation for the wildcats than for domestic cats. References to specific figures for domestic cats are made both in the text and in figure captions.
Comparison of Body Weight and Brain Size of the Two SpeciesThe average body weight of F. silvestris tartessia males is about 6.5 kg, and of females about 4 kg (Rodríguez de la Fuente, 1979). Our two wildcats were lean and weighed less than average: the male (S1) weighed 3.7 kg and the female (S2) weighed 3.3 kg. Despite these modest body weights, the brains of the male and female wildcats weighed 37 gm and 31 gm, respectively. These values are far above the domestic cat average: 27.6 gm with a standard deviation of ± 1.5 gm for male domestic cats, and 26.5 ±1.35 gm for females (Latimer, 1938). Even the brain weight of the small female wildcat reproduced in Figure 1 is 3.3 standard deviations above that of female domestic cats. Our huge 9-kg male domestic cat had a brain weight of only 28.25 gm. This is 9 gm less than the brain weight of the less massive but equally tall male wildcat. In absolute terms, the difference in brain weight between the two adult wildcats and domestic cats is in the neighborhood of 20 to 30%. This difference conforms closely to that which we anticipated based on the allometric relationship between brain and body weight derived from a wide range of felids (Davis, 1962; Radinsky, 1975; Pagel and Harvey, 1989): brain mass = 0.23 (average body mass)0.61 The pattern of gyri and sulci in wildcats conforms to the typical felid pattern (Fig. 1; cf. Radinsky, 1975). The lateral, posterolateral, and suprasylvian gyri are arranged in a common pattern that Otsuka and Hassler (1962) refer to as type III. The lateral and suprasylvian gyri are wider in the wildcats than is typical in domestic cats. For example, the lateral gyrus was between 7.0 and 8.5 mm wide in the wildcats compared to typical values between 5.0 and 6.5 mm in domestic cats (in vivo values, Reinoso-Suárez, 1961).Variation in the sulci in wildcats and domestic cats, particularly in the occipital region, has been reported previously by Röhrs (1955). However, given the extensive variation in sulcal patterns in domestic cats (Otsuka and Hassler, 1962; Kawamura, 1971), and even between right and left sides of one of our wildcats (Fig. 1), such differences are not reliable criteria for distinguishing between species. Although the breadth of the cranium is greater in wildcat, the stereotaxic coordinates of bregma and inion do not differ appreciably between species. The thickness of bones of the cranial vault is much reduced in wildcats (for example, the thickness of the temporal bone is merely 1.25 mm in wildcat versus 2.6 mm in domestic cats). In this case, the thick skulls of domestic cats do house smaller brains.
Analysis of Retinal StructureConstancy of retinal dimensions. There is complete overlap in the area of wildcat and domestic cat retinas. The range among the four wildcat retinas is from 528 to 570 mm2, whereas the range among domestic cats is from 460 to 640 mm2 (our data; Hughes, 1975; Chalupa et al., 1984). Our huge domestic cat had retinal areas of 570 and 600 mm2. Linear retinal measurements are also equivalent: the distance from the center of the area centralis to the center of the optic disk in the wildcat retinas is between 3.37 mm (S2 right) and 3.55 (S1 right), precisely in the same range as that reported in Nikara et al. (1968), Wässle et al. (1975), and Hughes (1975). It is also likely that posterior nodal distances and retinal magnification (about 213 µm per degree near the area centralis) in the two species are the same. Differences in rod and cone distributions . A quantitative analysis of the photoreceptor mosaic was possible in both retinas from the male wildcat S1. Data from this animal demonstrate that densities of cone photoreceptors can reach higher densities in wildcats than has ever been reported in domestic cats. The difference appears to be most marked in the central retina, particularly at the center of the area centralis where cone densities of up to 100,000/mm2 were encountered in this wildcat (Fig. 2). In comparison, the highest cone density we have yet encountered in domestic cats is between 35,000/mm2 and 40,000/mm2, a range that is itself about 25% higher than peak cone densities reported in previous studies of this species (Steinberg et al., 1973, their figs. 1, 2, and 6; Wässle and Riemann, 1978, their fig. 2). Cone densities are also high in the periphery of this wildcat’s retinas (Figs. 3, 4). However, the difference is not as great as in the area centralis. For example, along most of the horizontal meridian, cone densities are only 20–30% higher than in the domestic cat at comparable eccentricities. Although not studied in the same detail, there also appears to be a comparative surplus of cones in dorsal and ventral retina of the wildcat in comparison to the domestic cat. To obtain a rough estimate of the difference in the total cone population, we integrated the area under the curves in Figs. 3 and 4. The ratio of these areas is 1:1.3 (domestic:wildcat). Therefore, along this axis, domestic cats typically have 25% fewer cones than does wildcat S1.
Conversely, the rod densities were much lower in the area centralis of wildcat S1 than has ever been measured in domestic cats (our data and Steinberg et al., 1973). Rod densities drop to well under 50,000/mm2 in the center of the area centralis of S1 (Fig. 2), but in domestic cats we have been unable to locate any fields in the area centralis of any animal in which rod densities fall to less than 200,000/mm2. Along most of the horizontal streak of the wildcat, rod densities average between 300,000 and 400,000/mm2. This is on the low side of the range we have observed in the horizontal streak of domestic cats. In both species, rod densities range up to 550,000 in the dorsal periphery. To estimate the difference in the rod population we again integrated the area under the curves (Figs. 3 and 4). The ratio is 1.2:1 (domestic:wildcat).
Figure 4. Gradients in domestic cat cone and rod densities through the area centralis and along the horizontal axis (domestic cat D8). Faint gray curves in both A and B are taken from data in Steinberg et al. (1973).
Marked Differences in Ganglion Cell Numbers and DistributionTotal ganglion cell densities are substantially higher in all retinas of both wildcats than in domestic cats, both in the area centralis and across the retinal periphery (Fig. 5A,B). For example, in the area centralis, ganglion cell densities are 50% to nearly 100% higher in the wildcats than in domestic cats. In particular, the peak density of HRP-labeled ganglion cells in the right retina of S1 (contralateral to the injected hemisphere) is 15,100 cells/mm2 at a location 40 µm nasal to our estimate of the position of the center of the decussation line (Fig. 6A,B). At the decussation line itself, the density of labeled and unlabeled cells in S1 is 10,100 and 5,900 cells/mm2, respectively, giving a peak density of about 16,000/mm2. In wildcat S2, a case in which both retinas were stained with toluidine blue, the peak density of cells with large nucleoli in the area centralis is 18,400 in the left retina (Fig. 6D) and 20,900 (a peak of 26 cells in an area of 1250 µm2) in the right retina. In comparison, the highest packing density of HRP-labeled retinal ganglion cells we have found in the center of the area centralis of a domestic cat is 10,500/mm2 (Fig. 5B). This value matches peak ganglion cell densities reported in numerous previous studies of domestic cat retina (Hughes, 1975; Stone, 1978; Stone et al., 1982; Chalupa et al., 1984; Wong and Hughes, 1987a). It is probable that the reduction in cone and ganglion cells densities in the area centralis of the domestic lineage have been matched by a reduction in sampling resolution of both cell arrays, as well as in photopic acuity. Ganglion cell densities in the periphery are also greater in both wildcats than in domestic cats. However, the quantitative difference is less marked, averaging of 15-25% (Fig. 5). For example, in the field of cells depicted in Fig. 7, the density of HRP-labeled ganglion cells is 300/mm2 at a mean eccentricity of 9.4 mm. At this eccentricity in the domestic cat, ganglion cell densities are typically approximately 200/mm2 (Fig. 5B, 8, and see Stone, 1978; Chalupa et al., 1984).
Decussation pattern does not differ. The pattern of decussation of ganglion cell axons was examined in wildcat S1 by retrograde labeling from one hemisphere (Fig. 6A, B). The characteristics of the decussation pattern and the relative sizes of the temporal and nasal retinal components appear indistinguishable at a qualitative level from those noted in domestic cats by previous investigators (Cooper and Pettigrew, 1979; Jacobs et al., 1984, their figure 1). The horizontal streak. We were struck by the prominence of the
horizontal streak in the wildcat retinas. However, our quantitative
analysis revealed that the increment in cell density in the wildcat streak
is of the same magnitude as that seen elsewhere in peripheral retina (Fig.
5). For example, the density of labeled retinal ganglion cells in the
mid-nasal periphery of the visual streak (6–12 mm eccentricity) averages
1,000 cells/mm2 in wildcat S1 and about 600–700
cells/mm2 in domestic cats (Rowe and Stone,
1976; Chalupa et al., 1984). Studies by Peichl and colleagues (L. Peichl,
personal communication) have shown a marked difference in the development
of the horizontal steak in wild and domestic dogs.
Conservation of alpha cell number and distribution. While the total ganglion cell density is higher in wildcats than has ever been reported in the domestic cat, this is not true of one particular ganglion cell class: densities of alpha cells are almost precisely the same in both species (Fig. 9). For example, alpha cell density in the area centralis is between 120 and 150 cells/mm2 in both wildcats, whereas in domestic cats, alpha cell density is between 130 and 200 cells/mm2 (our data from three domestic cats; cf. Wässle et al., 1975; Stone, 1978; Kirby and Chalupa, 1986). We counted 410, 425, and 428 HRP-labeled alpha cells in a 3-mm-high by 2-mm-wide region located just nasal to the area centralis in three domestic cats. In comparison, we counted 411 HRP-labeled alpha cells in the same area in wildcat S1. Similarly, in the HRP labeled retina of wildcat S1, in which alpha cells can be identified unambiguously even in the center of the area centralis, there are 53 alpha cells in a nasal hemicircle with a radius of 500 µm centered on the area centralis (52 labeled and 1 unlabeled). This is the precisely the same number of alpha cells as identified in this region by Wässle et al. (1975, their fig. 8A). Similarly, we identified a total of 1,412 Nissl-stained alpha cells in the 36-mm2 region centered on the area centralis in wildcat S2 (Fig. 9), while Wässle et al. (1975, their figures 6A and 8A) identified 1,484 alpha cells in an equal area in a domestic cat—a difference of merely 5% (data derived from their figs. 6A and 8A). Densities of alpha cells are also remarkably close in the mid and far periphery of both species. For instance, the density of HRP-labeled alpha cells 9-10 mm above the area centralis in dorsal retina just nasal to the decussation line is 14/mm2 in wildcat S1, and 11/mm2 in wildcat S2. In domestic cats, values in this region range between 10 and 13/mm2 (Wässle et al., 1975, their fig. 6A; Stone, 1978, his fig. 5). Thus, it seems highly probable that the total alpha cell population in wildcats is in the same range as that for the domestic cat—5,000 to 7,000 (Wong and Hughes, 1987b).
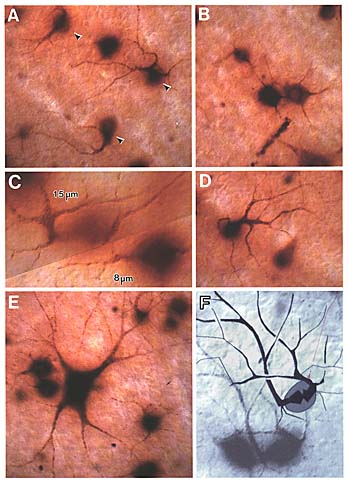
Figure 7 (large). Retinal ganglion cell mosaic in the wildcat S1. This field of cells covers an area of about 1 mm2 in the dorsal part of the retina. Coordinates are indicated on the axes. Large off-center alpha cells are represented by black irregular shapes. On-center alpha cells are similar, but unfilled. On- and off-center beta cells are represented by the large circlesùblack for off-center, unfilled for on-center, and gray for two beta cells of unknown subtype. The small circles represent the heterogeneous gamma cell class. Only a few of these cells could be categorized as on-center or off-center. Four unlabeled small neurons were identified in this field. They may have been unlabeled gamma cells or displaced amacrine cells.
No decline in alpha cell density in the wildcat’s area centralis. In wildcat S1 the pattern of HRP-labeled cells allowed us to define the location of the center of the area centralis with a precision of ± 25 µm, independent of the alpha cell distribution itself (Fig. 6A, B). This made it possible to assess whether or not there is a local decline in alpha cell density in the wildcat area centralis—an unresolved issue that has arisen in the domestic cat retina (Wässle et al., 1975; Stone, 1978; Mountcastle 1980, p. 539). In the wildcat, the density of alpha cells within a radius of 100 µm of the center is 127/mm2 and in two slightly more peripheral annuli, densities are 121 and 132 alpha cells/mm2. Nor was a central decline in alpha cell density noted in S2 (Fig. 9). Similar analyses of HRP-labeled retinas from three domestic cats, also did not demonstrate any appreciable decline in alpha cell density at the precise center of the area centralis.
Relative abundance of alpha, beta and gamma ganglion cells are
similar. The numbers of the alpha, beta, and gamma cell types were
studied in the dorsal periphery of wildcat S1. Here the proportions of HRP-labeled
ganglion cell types are similar to those in domestic cats (Figs. 7, 8).
Beta cells make up 50.2% of the local ganglion cell population (155 of
309), gamma cells make 45.3%, and alpha cells make up the remainder (14 of
309 cells in an area of 1.08 mm2). In the
domestic cat, beta cells make up 48.9%, gamma cells make up 45.3%, and
alpha cells make up the remainder (13 of 225 cells in an area of 1.08 mm2).
Thus, ratios of cell types in a region of retina in which the assignment
of cell types is unambiguous are similar in the two species. However,
given the finding that the alpha cell population is the same in both
species, but that the total population of ganglion cells is higher in
wildcats, it is clear that the overall proportion of alpha cells must be
slightly lower in wildcats than is typical in domestic cats (cf. Stone,
1978; Wong and Hughes, 1987b). Furthermore, at the area centralis of the
wildcat, a region in which the total ganglion cell density is particularly
high, alpha cells make up a smaller percentage (<1%) of the cell
population than in domestic cats (2–3%).
Ganglion cell size is the same. The higher average cell density in the wildcat retina could be associated with a reduction in mean cell body size. Such changes have been found following experimental manipulations in domestic cats (Kirby and Chalupa, 1986). We analyzed the sizes of all the cells in Figures 7 and 8. In wildcat S1, the average cross-sectional area of 309 ganglion cells at a location 9 mm above the area centralis is 357 µm2 (equivalent to an average diameter of 21.3 µm). In the domestic cat, the average size of the 230 ganglion cells in a comparable region, plotted in Fig. 8, is almost precisely the same—359 µm2. This equality in ganglion cell size is remarkable given the sizable difference in the local density of ganglion cells—286 cells/mm2 in the wildcat and 208/mm2 in the domestic cat.
More subtle differences in cell size between species are, in general, not masked by averaging across cell classes (Fig. 10). For example, the average beta cell diameter in S1 and the domestic cat DC13 are both 23 µm. Similarly, the average diameters of gamma cells in S1 and DC12 are both about 15 µm. However, cell size is quite variable among domestic cats, even at equivalent retinal coordinates. For instance, in domestic cat DC12 the mean size of HRP-labeled retinal ganglion cells 9-10 mm above the area centralis was 472 µm2 versus 359 µm2 in another domestic cat, DC13. It is also the case that HRP-labeled alpha cells in the wildcat S1 are smaller than in the domestic cats (Figs. 7, 8, 10). Given the small sample size, it seems prudent simply to conclude that data on cell size in wildcat S1 falls within the range seen in domestic cats.
Unsuspected dendritic differences between on- and off-center beta cells are conserved. The dendritic morphologies of on- and off-center beta cells in the wildcat differ consistently, both in the depth of their arborization (the standard criterion) and also in the shape of their proximal dendritic arbors (Fig. 11, 12). On-center cells almost invariably have 3 to 5 thin tapering and radiating primary dendrites (Figs. 11B,E, and 12) that spread out directly from the cell body and arborize neatly in the inner half of the inner plexiform layer at a distance of 6 to 7 µm from the equator of the cell body. In contrast, off-center cells almost invariably have 1 or 2 thick primary dendrites that ascend sharply, then arborize in the outer third of the inner plexiform layer (Figs. 11A, D, F and 12). Off-center arbors also have a more complex appearance than those of on-center beta cells, and the branch points of off-cell arbors are often flared outward (Fig. 11). Off-center beta cell dendrites are almost invariably more curved (spray-like) than those of on-center cells and are broader and more heavily labeled with HRP. Off-center arbors are also most commonly disposed asymmetrically with respect to the cell body, whereas on-center cell dendrites radiate symmetrically. In wildcat S1 on- and off-center cells can be reliably identified using these characteristics, without examining the depth of the dendritic arbor.
Analysis of the Optic NerveMarked species differences in numbers of optic axons in adults. The cross-sectional areas of the wildcats’ optic nerves were substantially greater than those of domestic cats: 2.95 mm2 in S1 and 3.24 mm2 in S2. This compares to a mean of about 2.0 mm2 in domestic cats (Williams et al., 1986). The packing density of fibers, however, is in the same range—8.8/100 µm2 in S1, 7.22/100 µm2 in S2. (Fig. 13A) and ~8.0/100 µm2 in domestic cats (Williams et al., 1983). Given these findings it is not surprising that the total population of axons is much higher in wildcats than in domestic cats: 260,000 ± 6,300 in S1 and 234,000 ± 4,500 in S2 versus 150,000 to 165,000 in domestic cats (Chalupa et al., 1984; Williams et al., 1986). The quality of fixation of the wildcat optic nerves, while more than adequate for counting axons, was not good enough to allow us to obtain reliable data on the distribution of fiber diameter. This difference between species is significant (t = 6.7, p < 0.05, two-tailed test; domestic cat data taken from Chalupa et al., 1984; Williams et al., 1986).
*Data from E39 domestic littermates from Williams et al. 1983,
their Table 1.
Analysis of the Dorsal Lateral Geniculate NucleusThe volume of the LGN differs greatly. The volume of the LGN
calculated from both frozen and celloidin sections is substantially
greater in the wildcat than in the domestic cat (Table 4). For example,
the left LGN volume of domestic cat D1 is 28.1 mm3,
whereas corresponding values for the two series of frozen sections from
the wildcats are 38.1 and 35.5 mm3. After
embedding the other hemisphere of the same domestic cat in celloidin, the
LGN volume is reduced by processing to merely 10.4 mm3.
Corresponding LGN volumes for the two wildcat hemispheres fixed, embedded,
and cut in precisely the same manner are 17.9 and 18.9 mm3.
A reasonable estimate based on our material and that kindly lent us by
Drs. Frost and Elberger (Table 4) is that the wildcat LGN has a volume
that is roughly half again as large as that of the domestic cat LGN. The
relative volumes of major components of the LGN are similar in domestic
cats and wildcats (Table 4). In both species, the A layer occupies about
37% of the nucleus, whereas the A1 layer occupies 28%.
* C = celloidin embedded material; F = material cut frozen Marked species differences in total neuron number. As the foregoing analysis might lead one to suspect, the neuron population of the wildcat LGN is much higher than that of the domestic LGN (Table 4, right column). The populations of LGN neurons in the two wildcats were 766,000 and 754,700 (averages of left and right nuclei for S1 and S2, respectively). In comparison, the average population in five domestic cats was only 510,000 ± 26,000. These estimates include interneurons and principal neurons, and our values for the domestic cat are extremely close to those calculated by Madarász et al. (1978, their estimate: 555,000 neurons). If we make the reasonable assumption that LGN cell populations are distributed normally in both species, then this species difference is highly significant (t = 15.34, p < 0.05, two-tailed test). Cell size in the LGN is the same. Neurons in the two species are
very closely matched in size. Sets of between 75 and 200 neurons were
measured in layers A, A1, and the C layers, in two to three sections from
each of six animals. No difference was found in cell size between domestic
cats and the wildcats (Table 5). In both species the smallest interneurons
range in size from 50 to 80 µm2, whereas
principal neurons range from 90 µm2to more than
400 µm2. Even a comparison of the size
distribution in wildcat and domestic cat cases with large differences in
LGN volume (18.9 mm3 versus 10.4 µm3)
demonstrates a remarkable similarity in the sizes of neurons in the two
species (Fig. 14).
Note to Table 5: Cross-sectional areas (µm2)
were measured at the focal plane in which this value reach a maximum. The
standard error of the mean for each value is between 3 and 9 µm2.
All material, except that from case MC1, was embedded in celloidin. In
caseMC1, the brain was cut frozen. There is a surprising degree of
variation among the mean size of cells in the C layers of domestic cats
(range from 103 to 164). This variation appears to be independent of cell
size in the magnocellular layers. In comparison with the domestic cat, it does not appear that any particular layer differs either in volume or in cell number more or less than the nucleus as a whole (Table 4). It is of course possible that the relative abundance of classes of LGN neurons—particularly classes 1 and 2 of Guillery (1966)—differ between wildcat and domestic cat. Unfortunately, these cell classes cannot be distinguished as easily in the LGN as they can in the retina. Estimates of cell number show much less variation than do those of the LGN volume. This is primarily because the three-dimensional counting method we have used is insensitive to differential shrinkage and does not require the application of often dubious correction factors (Williams and Rakic, 1988b). Discussion[Synopsis. From a quantitative standpoint, the visual systems of the Spanish wildcat and the domestic cat differ substantially. Populations of retinal ganglion cells and geniculate neurons are both 30–35% lower in the domestic cat than in the wildcat. The difference in ganglion cell populations is not matched by any change in retinal surface area, perhaps because ganglion cells make up such a small percentage of the total retinal cell population. In contrast, the LGN is smaller in the domestic cat than in the wildcat, almost precisely in proportion to the difference in total neuron number. Sizes of neurons do not differ in either part of the visual system in these closely related species.] The descent of the domestic cat. The species Felis silvestris dates back to the middle Pleistocene (Holsteinian interglacial period; Kurtén; 1965b; 1971). During the late Pleistocene, the ancestral population of large wildcats gave way to the smaller European and North African wildcat subspecies, Felis silvestris silvestris and Felis silvestris lybica. These subspecies provided the stock from which domestic cats trace their descent over 3,000 years ago (Zeuner, 1963; Wayne et al., 1989; Fig. 15). Although details of this phylogenetic reconstruction may be modified as more material is recovered, there can be little doubt that among extant wildcats, the Spanish subspecies is morphologically closest to the Pleistocene stem population. Dwarfing. There have been at least two distinct episodes of selection in the lineage that has led to the domestic cat. The first episode has been associated with a rapid decline in body size. This reduction occurred at the close of the Pleistocene, long before domestication (Kurtén, 1965a,b; Table 1). Such dwarfing is by no means exceptional; extremely rapid reduction in body size has been widespread among the Pleistocene mammalian fauna of Eurasia, North America, and Australia (Kurtén, 1959; Marschall and Corrunccini, 1978, Stanley, 1979, Raff and Kaufman, 1983). Rates of dwarfing have typically ranged between 4 and 40 darwins. With the exception of the Spanish wildcat subspecies, the reduction in body size in the Felis silvestris lineage has proceeded at a particularly rapid rate—about 30 darwins over the last 20,000 years (Kurtén, 1958, 1959; 1965b, his Fig. 10; one darwin is equivalent to an e-fold change over 1 million years). On the basis of our data, and conforming to allometric tendencies, the tempo of change in the visual system appears to have proceeded at a reduced, but still very rapid rate (about 15 darwins). As in other lineages, the reduction may have been linked with postglacial climatic change and human competition (Kurtén, 1965a, 1988; Van Valen, 1969; Martin and Klein, 1984). Domestication. The second episode of intense selection has been associated with domestication. This process has undoubtedly caused changes in brain, behavior, and reproduction (Darwin, 1890; Zeuner, 1963; Stephan, 1951; Bekoff et al., 1984). However, the effects of domestication on brain structure have not yet been studied in detail (but see the exceptional work of Menner, 1939; Rohrs, 1955; and Ebinger and Lohmer, 1987). One problem facing this type of analysis is that changes in brain structure associated with altered body size must be dissociated from those effects due only to domestication. In our cellular analysis of retina and LGN of cats we have also been unable to dissociate these effects. Although we have shown that the difference in average body size of the Spanish wildcat subspecies and the domestic cat is sufficient to account for the overall reduction in brain mass in the domestic lineage (see Results), it is probable that specific selective pressures, particularly those associated with cohabitation with humans, have also generated specific changes in brain structure. A comprehensive comparative analysis of other components of the CNS and of different wildcat subspecies would be particularly useful in sorting out the relative importance of size reduction and domestication in driving brain evolution. It would be especially interesting to study the brain of the smaller North African wildcat, Felis silvestris lybica.
Brain to Body Size Scaling: A Cellular Analysis of AllometryIn this study we have focused on quantitative evolutionary changes
within a small part of the central nervous system. Our data provide a
cellular perspective on allometric change in the size of the brain and
body. This cellular level of analysis complements previous work on
brain-body allometry, which has generally focused on such global factors
as ecological niche, taxonomic level, metabolic load, and developmental
timing (Eisenberg and Wilson, 1978; Lande, 1979; Armstrong, 1982; Martin
and Harvey, 1985, assessed in Mann et al., 1988; Preuss, 1992). Allometric exceptions. We found several interesting exceptions
in which numbers of cells appear not to have changed as one would predict
from the allometric relationship between brain and body size. First, the
population of rods in the domestic cat equals, and may even exceed, that
in the wildcat. Rod densities in the area centralis and along part of the
horizontal axis in domestic cats (our data and Steinberg et al., 1973) are
higher than those measured in the male wildcat S1. Although it would be
unwise to read too much into this difference, given the variability in rod
and cone densities in other species (Curcio et al., 1990; Wikler et al.,
1990; Williams, 1991), we can certainly say that the rod population is as
high (and possibly higher) in the domestic cat as in the Spanish wildcat.
Similarly, the population of alpha ganglion cells in the domestic cat has
not undergone any reduction. In fact, densities of alpha cells at the
center of the area centralis may be slightly higher in domestic cats than
in the wildcat retinas that we studied. This evolutionary stasis in alpha
cell number stands in marked contrast to the sharp decline in the total
ganglion cell population. A Subtle Difference Between On- and Off-Center Beta Cell Dendrites is Conserved in Both Felis Species
We initially thought that the marked dendritic differences noted between on- and off-center beta cells (symmetric versus asymmetric and thick versus thin primary dendrites) were unique to the wildcat (Figs. 11 and 12)—that we had finally detected a significant qualitative difference. However, careful inspection of domestic cat retinas revealed precisely the same structural differences between on- and off-center beta cells. Although we are the first to comment on this dichotomy between on- and off-center beta cells, some of these differences can be discerned in figures of previous papers on domestic cat ganglion cells (e.g., Wässle et al., 1981a; Rowe and Dreher, 1982; Stanford, 1987). These marked structural differences in dendrites suggest that a functional reanalysis such as that of Koch et al. (1982) would be revealing, and that these two subtypes of neurons may have unsuspected electrotonic differences. From an evolutionary perspective, it is also noteworthy that relatively subtle, previously undetected, dendritic differences have been conserved in this lineage despite large differences in numbers of these cells. An analysis of on- and off-center cells in other mammals would be of interest to assess the taxonomic breadth of this dichotomy. Developmental Mechanisms and Brain EvolutionAn intriguing question raised by these findings is at what stage of
development and in what manner the great differences between the brains of
wild and domestic species arise. As mentioned in the Results section, the
length of gestation in wild and domestic cats is about the same (63 days),
birth weight is roughly the same (100 ± 20 gm), and eye opening occurs at
the same age (7 to 10 days after birth). One explanation for the reduction
in the size of the domestic cat’s brain is that far fewer neurons are
generated early in development. A more counterintuitive, but equally
possible alternative, is that the same numbers of neurons are generated in
the domestic cat as in the wildcat, but that many more of these cells are
subsequently eliminated. For reasons listed below, we think that the
decrease in brain size in the domestic lineage is probably associated with
an increase in the incidence of cell death. AcknowledgementsThis research was supported in part by grant DGICYT PB88-0170 and a grant from the NIH. We are especially indebted to Mariano Sanz Pech and Antonio Pérez Alonso-Geta of the Institute for the Conservation of Nature, Madrid, Spain, for wildcat material. Rosa Sánchez Lozano provided expert technical assistance in processing celloidin-embedded material. We thank Drs. Leo Chalupa, Andrea Elberger, and Douglas Frost, for the generous use of material from their collections of domestic cat tissue, and Drs. Leo Chalupa, Robert Foehring, Dan Goldowitz, Todd Preuss, Anton Reiner, and Michael Rowe for critical comments on drafts of this paper. We thank Alexander G. Williams for production and editing of the HTML edition of this paper.
References
Armstrong E (1982) Relative brain size and metabolism in mammals. Science 220:1302–1304. Bekker JM, Stevens CF (1990) Two different ways evolution makes neurons larger. Prog Brain Res 83:37–45. Benveniste RE (1985) The contributions of retroviruses to the study of mammalian evolution. In: Molecular evolutionary genetics (MacIntyre RJ, ed), pp 359–417. New York: Plenum. Boycott BB, Wässle H (1974) The morphological types of ganglion cells of the domestic cat’s retina. J Physiol (Lond) 240:397–419. Brændgaard H, Gundersen HJG (1986) The impact of recent stereological advances on quantitative studies of the nervous system. J Neurosci Meth 18:39–78. Buss LW (1987) The evolution of individuality. Princeton: Princeton Univ Press. Carroll RL (1988) Vertebrate paleontology and evolution. New York: Freeman. Chalupa LM, Williams RW, Henderson Z (1984) Binocular interaction in the fetal cat regulates the size of the ganglion cell population. Neuroscience 12:1139–1146. Chalupa LM, Lia B (1991) The nasotemporal division of retinal ganglion cells with crossed and uncrossed projections in the fetal rhesus monkey. J Neurosci 11:191–202. CITES (1991) Convention on international trade in endangered species of wild flora and fauna. Appendices I–III. Endangered species convention. Oct 1, 1991, 50 CFR 23.23. Endangered and threatened wildlife and plants. July 15, 1991:50 CFR 17.11. Collier G, O’Brien SJ (1985) A molecular phylogeny of the Felidae: immunological distance. Evolution 39:473–487. Cooper ML, Pettigrew JD (1979) The decussation of the retinothalamic pathway in the cat, with a note on the major meridians of the cat’s eye. J Comp Neurol 187:285–312. Clutton–Brock J (1981) Domesticated animals from early times. Cambridge: Cambridge Univ Press. Curcio CA, Sloan KR, Kalina RE, Hendrickson AE (1990) Human photoreceptor topography. J Comp Neurol 292:497–523. Darwin C (1890) The variation of animals and plants under domestication. 2nd ed, revised. New York: Appleton and Co. Davis DD (1962) Allometric relationships in lions vs. domestic cats. Evolution 16:505–514. Ebinger P, Lohmer R (1987) A volumetric comparison of brains between greylag geese (Anser anser L.) and domestic geese. J Hirnforsch 28:291–299. Edinger T (1948) Evolution of the horse brain. Geol Soc Amer Mem 25:1–177. Edinger T (1966) Brains from 40 million years of Camelid history. In: Evolution of the forebrain (Hassler R, Stephan H, eds), pp 153–161. Stuttgart: Thieme. Eisenberg JF (1981) The mammalian radiation. An analysis of trends in evolution, adaptation, and behavior. Chicago: Univ Chicago Press. Eisenberg JF, Wilson DE (1978) Relative brain size and feeding strategies in the Chiroptera. Evolution 32:740–751. Eldredge N, Gould SJ (1972) Punctuated equilibria: an alternative to phyletic gradualism. In: Models in Paleobiology. (Schopf TJM, ed), pp 82–115. San Francisco: Freeman, Cooper, and Co. Finlay BL, Wikler KC, Sengelaub DR (1987) Regressive events in brain development and scenarios for vertebrate brain evolution. Brain Behav Evol 30:102–117. Glücksmann A (1951) Cell deaths in normal vertebrate ontogeny. Biol Rev 26:59–86. Goldowitz D (1989) Cell allocation in mammalian CNS formation: Evidence from murine interspecies aggregation chimeras. Neuron 3:705–713. Gould SJ (1977) Ontogeny and phylogeny. Cambridge, Mass: Harvard Univ Press. Gould SJ, Eldredge N (1986) Punctuated equilibrium at the third stage. Syst Zool 35:143–148. Guillery RW (1966) A study of Golgi preparations from the dorsal lateral geniculate nucleus of the adult cat. J Comp Neurol 128:21–50. Haltenorth T (1953) Die Wildkatzen der Alten Welt. Eine Ü;bersicht über die Untergattung Felis. Leipzig: Akademische Verlagsgesellschaft, Geest and Portig. Hamburger V, Oppenheim RW (1982) Naturally occurring neuronal death in vertebrates. Neurosci Comm 1:39–55. Harvey PH, Krebs JR (1990) Comparing brains. Science 249:139–146. Harvey PH, Purvis A (1991) Comparative methods for explaining adaptations. Nature 351:619–624. Hemmer H (1976) Gestation period and postnatal development in Felids. In: The world’s cats, Vol 3, No 2, (Eaton RL, ed) pp 90–100. Seattle: Carnivore Research Institute, Burke Museum, Univ Washington. Holloway RL (1968) The evolution of the primate brain: some aspects of quantitative relations. Brain Res 7:121–172. Hughes A (1975) A quantitative analysis of the cat retinal ganglion cell topography. J Comp Neurol 163:107–128. Jacobs DS, Perry VH, Hawken MJ (1984) The postnatal reduction of the uncrossed projection from the nasal retina in the cat. J Neurosci 4:2425–2433. Jerison HJ (1973) Evolution of the brain and intelligence. New York: Academic Press. Jerison H (1979) Brain, body and encephalization in early primates. J Hum Evol 8:615–635. Kaas JH (1987) The organization and evolution of neocortex. In: Higher brain function: recent explorations of the brain’s emergent properties (Wise SP, ed), pp 347–378. New York: Wiley. Katz MJ, Lasek RJ (1978) Evolution of the nervous system: Role of ontogenetic mechanisms in the evolution of matching populations. Proc Natl Acad Sci USA 75:1349–1352. Kirby MA, Chalupa LM (1986) Retinal crowding alters the morphology of alpha ganglion cells. J Comp Neurol 251:532–541. Koch C, Poggio T, Torre V (1982) Retinal ganglion cells: a functional interpretation of dendritic morphology. Phil Trans R Soc Lond B 298:227–264. Kurtén B (1954) Observations on allometry in mammalian dentition; Its interpretation and evolutionary significance. Acta Zool Fennica 76:1–122. Kurtén B (1958) A differentiation index, and a new measure of evolutionary rates. Evolution 12:146–157. Kurtén B (1959) Rates of evolution in fossil mammals. Cold Spring Harbor Symp Quant Biol 24:205–215. Kurtén B (1965a) The Carnivora of the Palestine caves. Acta Zool Fennica 107:1–74. Kurtén B (1965b) On the evolution of the European wild cat, Felis silvestris Schreber. Acta Zool Fennica 111:1–29. Kurtén B (1971) The age of mammals. New York: Columbia Univ Press. Kurtén B (1988) On evolution and fossil mammals. New York: Columbia Univ Press. Lande R (1979) Quantitative genetic analysis of multivariate evolution applied to brain:body size allometry. Evolution 33:402–416. Latimer HB (1938) The weights of the brain and of its parts, of the spinal cord and of the eyeballs in the adult cat. J Comp Neurol 68:395–404. Lia B, Williams RW, Chalupa LM (1986) Does axonal branching contribute to the overproduction of optic nerve fibers during early development of the cat’s visual system. Dev Brain Res 25:296–301. Lindemann W, Rieck W (1953) Beobachtungen bei der Aufzucht von Wildkatzen. Zschrft f Tierpsychol 10:92–119. Madarász M, Gerle J, Hajdu F, Somogyi G, Tömböl T (1978) Quantitative histological studies on the lateral geniculate nucleus in the cat. II. Cell numbers and densities in several layers. J Hirnforsch 19:159–164. Mann MD, Glickman SE, Towe AL (1988) Brain/body relations among myomorph rodents. Brain Behav Evol 31:111–124. Marschall LG, Corrunccini RS (1978) Variability, evolutionary rates, and allometry in dwarfing lineages. Paleobiology 4:101–119. Martin PS, Klein RG (eds) (1984) Quaternary extinctions: a prehistoric revolution. Tucson: Univ Arizona Press. Martin RD, Harvey PH (1985) Brain size allometry. Ontogeny and phylogeny. In: Size and scaling in primate biology (Jungers WL, ed), pp 147–173. New York: Plenum. Menner E (1939) Vergleichende Untersuchungen über die Retina wildlebender und domestizierter Caniden. Z Naturw 93:77–88. Mountcastle VB (1980) Medical physiology, 14th ed, St. Louis: Mosby. Nikara T, Bishop PO, Pettigrew JD (1968) Analysis of retinal correspondence by studying receptive fields of binocular single units in the cat striate cortex. Exp Brain Res 6:353–372. Oppenheim RW (1991) Cell death during development of the nervous system. Annu Rev Neurosci 14:453–501. Otsuka R, Hassler R (1962) Über Aufbau und Gliederung der corticalen Sehsphare bei der Katze. Arch Psychiat Z ges Neurol 203:212–234. Pagel MD, Harvey PH (1989) Taxonomic differences in the scaling of brain on body weight among mammals. Science 224:1589–1593. Peichl L, Wässle H (1981) Morphological identification of on– and off–centre brisk transient (Y) cells in the cat retina. Proc R Soc Lond B 212:139–156. Perry VH, Linden R (1982) Evidence for dendritic competition in the developing retina. Nature 297:683–685. Preuss TM (1992) The role of neurosciences in primate evolutionary biology: Historical commentary and prospectus. In: Primates and their relatives in phylogenetic perspective (MacPhee RDE, ed), pp xx–xx. New York: Plenum. Provis JM, van Driel D, Billson FA, Russell P (1985) Human fetal optic nerve: overproduction and elimination of retinal axons during development. J Comp Neurol 238:92–101. Purves D (1988) Body and Brain. A Trophic Theory of Neural Connections. Cambridge, Mass: Harvard Univ Press. Purves D, Rubin E, Snider WD, Lichtman J (1986) Relation of animal size to convergence, divergence, and neuronal number in peripheral sympathetic pathways. J Neurosci 6:158–163. Radinsky LB (1973) Evolution of the canid brain. Brain Behav Evol 11:169–202. Radinsky LB (1975) Evolution of the felid brain. Brain Behav Evol 11:214–254. Radinsky LB (1981) Brain evolution in extinct South American ungulates. Brain Behav Evol 18:169–187. Raff RA, Kaufman TC (1983) Embryos, genes, and evolution. The developmental–genetic basis of evolutionary change. New York: Macmillan. Rakic P, Riley K (1983) Overproduction and elimination of retinal axons in the fetal rhesus monkey. Science 219:1441–1444. Reiner A (1991) A comparison of neurotransmitter–specific and neuropeptide–specific neuronal cell types present in the dorsal cortex in turtles with those present in the isocortex in mammals: Implications for the evolution of isocortex. Brain Behav Evol 38:53–91. Reinoso–Suárez F (1961) Topographischer Hirnatlas der Katze für experimental–physiologische Untersuchungen. Darmstadt: E. Merck. Rodr&icacute;guez de la Fuente F (1979) El gato montes. In: Fauna Iberica y Europea. Vol. VI: Bosque Caducifolio. Bosque de Coníferas y Taiga. pp 60–69. Barcelona: Salvat Editores. Röhrs M (1955) Vergleichende Untersuchungen an Wild– und Hauskatzen. Zool Anz 155:53–69. Rosen GD, Harry JD (1990) Brain volume estimation from serial section measurements: a comparison of methodologies. J Neurosci Meth 35:115–124. Rowe MH, Stone J (1976) Properties of ganglion cells in the visual streak of the cat’s retina. J Comp Neurol 167:99–126. Rowe MH, Dreher B (1982) Functional morphology of beta cells in the area centralis of the cat’s retina: a model for the evolution of central retinal specializations. Brain Behav Evol 21:1–23. Schindewolf OH (1950) Grundfragen der Palaontologie. Stuttgart: Schwarzerbart. Shatz CJ (1983) The prenatal development of the cat’s retinogeniculate pathway. J Neurosci 3:482–499. Smith LA (1928) A comparison of the number of nerve cells in the olfactory bulbs of domesticated albino and wild Norway rats. J Comp Neurol 45:483–499. Stanford LR (1987) X–cells in the cat retina: relationships between the morphology and physiology of a class of cat retinal ganglion cells. J Neurophysiol 58:940–964. Stanley SM (1975) A theory of evolution above the species level. Proc Natl Acad Sci USA 72:646–650. Stanley SM (1979) Macroevolution. Pattern and process. San Francisco: Freeman. Steinberg RH, Reid M, Lacy PL (1973) The distribution of rods and cones in the retina of the cat (Felis domesticus). J Comp Neurol 148:229–248. Stone J (1978) The number and distribution of ganglion cells in the cat’s retina. J Comp Neurol 180:753–772. Stone J, Rapaport DH, Williams RW, Chalupa LM (1982) Uniformity of cell distribution in the ganglion cell layer of prenatal cat retina: Implications for mechanisms of retinal development. Dev Brain Res 2:231–242. Van Valen L (1969) Evolution of communities and late Pleistocene extinctions. North Amer Paleont Convention, Chicago Proc:469–485. von Baer KE (1828) Über Entwickelungsgeschichte der Thiere. Beobachtung und Reflexion. Part I. Königsberg: Gebrüdern Bornträger (available at Beineke Library, Yale University). Vrba ES (1983) Macroevolutionary trends: new perspectives on the roles of adaptation and incidental effect. Science 221:387–389. Wässle H, Levick WR, Cleland BG (1975) The distribution of the alpha type of ganglion cells in the cat’s retina. J Comp Neurol 159:419–438. Wässle H, Riemann RJ (1978) The mosaic of nerve cells in the mammalian retina. Proc R Soc Lond B 200:441–461. Wässle H, Boycott BB, Peichl L (1981a) Morphology and mosaic of on– and off–beta cells in the cat retina and some functional considerations. Proc R Soc Lond B 212:177–195. Wässle H, Peichl L, Boycott BB (1981b) Morphology and topography of on– and off–alpha cells in the cat retina. Proc R Soc Lond B 212:157–175. Wayne RK, Benveniste RE, Janczewski DN, O’Brien SJ (1989) Molecular and biochemical evolution of the Carnivora. In: Carnivore behavior, ecology, and evolution. (Gittleman JL ed), pp 465–494. Ithaca New York: Cornell Univ Press. Weber AJ, Kalil RE (1983) The percentage of interneurons in the dorsal lateral geniculate nucleus of the cat and observations on several variables that affect the sensitivity of horseradish peroxidase as a retrograde marker. J Comp Neurol 220:336–346. Wikler KC, Finlay BL (1989) Developmental heterochrony and the evolution of species differences in retinal specializations. In: Development of the vertebrate retina. (Finlay BL, Sengelaub DR, eds), pp 227–246. New York: Plenum. Wikler KC, Perez G, Finlay, BL (1989) Duration of retinogenesis: its relationship to retinal organization in two Crisitine rodents. J Comp Neurol 285:157–176. Wikler KC, Williams RW, Rakic P (1990) Photoreceptor mosaic: number and distribution of rods and cones in the rhesus monkey retina. J Comp Neurol 297:499–508. Williams RW (1991) The human retina has a cone–enriched rim. Vis Neurosci 6:403–406. Williams RW, Chalupa LM (1982) Prenatal development of the retinocollicular projection in the cat: an anterograde transport study. J Neurosci 2:604–622. Williams RW, Chalupa LM (1983) An analysis of axon caliber within the optic nerve of the cat: evidence of size groupings and regional organization. J Neurosci 3:1554–1564. Williams RW, Bastiani MJ, Lia B, Chalupa LM (1986) Growth cones, dying axons, and developmental fluctuations in the fiber population of the cat’s optic nerve. J Comp Neurol 246:32–69. Williams RW, Herrup K (1988) The control of neuron number. Annu Rev Neurosci 11:423–453. Williams RW, Rakic P (1988a) Elimination of neurons from the rhesus monkey’s lateral geniculate nucleus during development. J Comp Neurol 272:424–436. Williams RW, Rakic P (1988b) Three–dimensional counting: An accurate and direct method to estimate numbers of cells in sectioned material. J Comp Neurol 278:344–352. Williams RW, Borodkin M, Rakic P (1991) Growth cone distribution patterns in the optic nerve of fetal monkeys: Implications for mechanisms of axon guidance. J Neurosci 11:1081–1094. Wimer RE, Wimer CC, Vaughn JE, Barber RP, Balvanz BA, Chernow CR (1976) The genetic organization of neuron number in Ammon’s horns of house mouse. Brain Res 118:219–243. Wong ROL, Hughes A (1987a) Developing neuronal populations of the cat retinal ganglion cell layer. J Comp Neurol 262:473–495. Wong ROL, Hughes A (1987b) The morphology, number, and distribution of a large population of confirmed displaced amacrine cells in the adult cat retina. J Comp Neurol 255:159–177. Zeuner FE (1963) A history of domesticated animals. New York: Harper and Row.
ContentsAbstract Comparison of body and brain weights Evolutionary history of the domestic cat
Received April 14, 1992; revised July 13, 1992; accepted July
15, 1992; published January 1993. This paper was reviewed by Sandra Blakeslee in The New York Times.
Since 11 August 98
|
||||||||||||||||||||||||||||||||||||||||||||||||||||||||||||||||||||||||||||||||||||||||||||||||||||||||||||||||||||||||||||||||||||||||||||||||||||||||||||||||||||||||||||||||||||||||||||||||||||||||||||||||||||||||||||||||||||


Neurogenetics at University of Tennessee Health Science Center
| Print Friendly | Top of Page |
Mouse Brain Library | Related Sites | Complextrait.org
